Your Dust Collection System Just Became a Data Powerhouse
Updated: May 22
Most factories treat their dust collection system as invisible infrastructure. It runs. The air moves. The filters get changed. And that's about it.
But your dust collection system is quietly generating some of the most valuable operational data in your facility — fan power consumption, workstation activity, air volume, filter health, system utilization — second by second, shift after shift. Until now, almost none of it was captured in a useful way.
That changes with the new greenBOX Integrated DataMining system.
What Is greenBOX DataMining?
Every greenBOX controller — Nxt, Max, and Master — now ships with an on-board time series database powered by a 256 GB SSD. It automatically records high-resolution operational data at 5-minute intervals and retains a full rolling year of history, with no external servers or third-party subscriptions required.
The system captures data across every layer of your dust collection operation:
Fan Performance — Motor power output (kW) and total static pressure at every moment of every shift.
System-Wide Metrics — Total air volume (CFM or m³/h), overall system utilization, and filter differential pressure — all in real time.
Workstation Activity — Utilization for every individual workstation, expressed as a percentage of shift time.
Controller Health — CPU, memory, and disk status, plus system logs including errors, warnings, and operational events.
Energy Savings Calculations — Total kWh saved and dollar savings in local currency, calculated against your entered shift schedules and electricity rate.
Everything is available in both metric and imperial (US) units.
Accessible From Any Device, Anytime
Accessing this data doesn't require special software, a dedicated terminal, or a call to IT. The greenBOX includes a full-featured built-in web server. Anyone on your network — maintenance crew, shift manager, energy team, plant director — can pull up live system performance simply by typing the greenBOX URL into any browser on any device: phone, tablet, or computer.

greenBOX user interface could be displayed on a monitor in the office, meeting room, for at-a-glance insights into your dust collection system
Multiple people can connect simultaneously. Your maintenance tech can watch filter performance while your shift manager checks workstation utilization in a different part of the building at the same time.
Charts are switchable between the last 30 minutes, 1 day, 7 days, 30 days, and 90 days — giving you everything from a real-time snapshot to a quarter-long operational view.

90-day greenBOX DataMining chart showing $55,662 in savings (projecting to $233,516 annual electricity savings for a facility with three dust collection systems), alongside system utilization (%) and air volume (CFM) metrics.
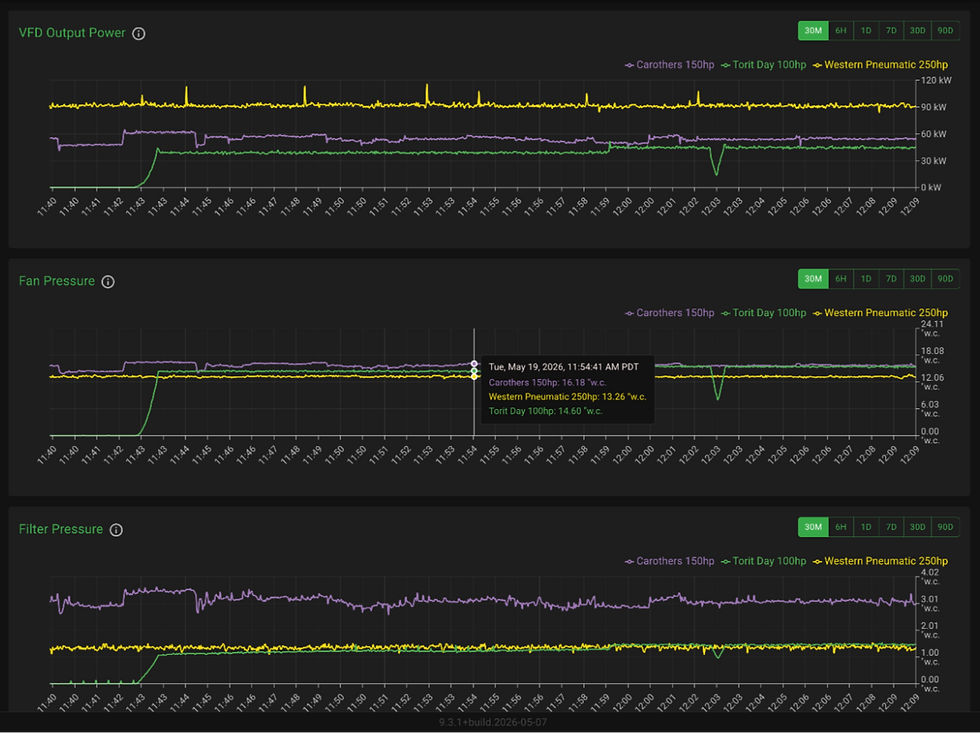
30-minute greenBOX DataMining chart showing Fan Motors VFD Output Power alongside Fan Total Static Pressure and Filter Differential Pressure.
One Year of Data, Three Export Buttons
When you're ready to go beyond the built-in charts, the greenBOX interface gives you three distinct CSV export options:

Users can export high-resolution data to their device’s “Downloads” folder through three distinct buttons on the greenBOX interface
System-Wide Metrics — Air volume (CFM), fan total static pressure, filter differential pressure, and overall utilization — all at 5-minute resolution.
VFD Fan Motor Power — Power data as reported directly by the Variable Frequency Drives. This is the file utility companies ask for when verifying electricity savings for incentive program applications.
Workstation Utilization — Granular activity data for every individual workstation at 5-minute intervals.
All three files can be imported directly into Excel or Google Sheets. From there, AI tools like Microsoft Copilot, Claude, or Google Gemini can analyze specific timeframes, flag operational anomalies, and generate month-over-month comparisons — no data analyst required.
Note: We recommend downloading your data once per year to maintain a permanent record. The greenBOX retains high-resolution logs for a rolling 12-month period only.
What the Data Actually Tells You
To illustrate the kind of insight DataMining unlocks, here's a real example from a woodworking facility. After exporting workstation utilization data and running it through an AI model (Gemini), the results showed:

Factory-wide workstation utilization generated by Google Gemini AI from exported DataMining CSV files, showing each workstation's active utilization as a percentage of total shift hours.
The top five most active workstations were running at 57–62% utilization, representing the primary bottlenecks in the current production flow. Roughly 20 workstations showed 0% utilization during the shift — most labeled as "Spare," meaning backup units not needed for that day's schedule. The majority of active machines operated in a 20–60% utilization band, suggesting either the natural overhead of woodworking processes or meaningful spare capacity available for production scaling.
This kind of analysis transforms what would normally be an invisible operational question — "are we running efficiently?" — into something you can see, measure, and act on.
Built for Every Role in the Building
Maintenance Teams — Real-time health monitoring across the entire collection network — fan performance, filter status, system logs — so they can catch issues before they become shutdowns.
Shift Managers — An instant utilization overview across every workstation and every connected system, all from a single interface. In a large facility running dozens of workstations, that consolidated visibility is significant.
Energy Managers & Environmental Officers — The VFD power export is exactly the file utility companies request for incentive applications. And because the system records actual exhausted air volume, it supports documentation for environmental permits — potentially reducing compliance costs.
Corporate & Plant Leadership — Month-over-month utilization trends, production correlation, and cross-facility benchmarking. The greenBOX also continuously measures hood losses at every workstation — specs most machinery manufacturers never publish — so every future system design can be engineered from actual field data rather than estimates.
Why This Matters Now
Electricity costs are rising — and faster than most facilities have planned for. The proliferation of AI data centers is driving electricity demand to levels the grid hasn't seen before. In the PJM Interconnection — the largest power grid in the United States — independent market monitors reported that prices nearly doubled over the past year alone.
Dust collection fans carry the largest electrical motors in most factories. On a traditional always-on legacy system, they run at full power all shift, every shift, regardless of how many workstations are actually active. Ecogate's on-demand control system already reduces that consumption by an average of two-thirds. DataMining now gives you the visibility to verify those savings, document them, and continue optimizing over time.
A Different Kind of Monitoring
The major dust collector manufacturers — Donaldson, Nederman, Camfil — all offer monitoring solutions. But their focus is the collector itself: cartridge life, filter performance, maintenance alerts. The workstation level, the fan system, the factory floor — those remain a black box.
Ecogate DataMining is designed around a different premise. The collector is one component of a system. The system exists to serve the factory. And the factory is what actually needs to be understood.
That means holistic monitoring: from the gate at each individual workstation, through the duct network, through the fan and VFD, through the collector, and back — with the active control to match. No other dust collection monitoring solution combines this level of visibility with the ability to act on it in real time.
Monitoring Solution Feature | Donaldson iCue | Nederman Insight | Camfil Gold Link+ | Ecogate DataMining |
Core Objective | Alerts and predictive maintenance for dust collector filters or cartridges | Optimization of filter cleaning and predictive maintenance for collectors | Predictive cartridge maintenance and notifications | Holistic systems monitoring and workstation tracking, comprehensive energy and electricity savings analysis, and factory-wide efficiency alerts |
Control Capabilities | None (Observation only) | None (Observation only; manages pulse-cleaning cycles) | None (Observation only) | Active Control (manages workstation gates, regulates VFD fan speeds, and ensures minimum transport air velocity throughout the ducting) |
Workstation Analytics, Factory -Wide Efficiency Monitoring | Unavailable | Unavailable | Unavailable | Available (provides comprehensive factory-wide efficiency tracking, workstation-specific pressure and air volume/velocity, and individual machine uptime monitoring) |
Turn Your Airflow Into Cash Flow
If your facility is still running a legacy dust collection system, the data you're not capturing is costing you in more ways than one: wasted electricity, missed utility incentives, invisible production bottlenecks, and decisions made on guesswork instead of evidence.
greenBOX Integrated DataMining is included in every new greenBOX Nxt, Max, and Master controller — no add-on required.
Ready to see what your system has been trying to tell you?
Frequently Asked Questions
What is greenBOX Integrated DataMining?
greenBOX Integrated DataMining is a built-in analytics system included in every greenBOX Nxt, Max, and Master controller. It uses an on-board 256 GB SSD to automatically record high-resolution operational data — fan power, air volume, filter pressure, workstation utilization, and energy savings — at 5-minute intervals, retaining a full rolling year of history with no external servers or subscriptions required.
What data does greenBOX DataMining collect?
The system monitors fan motor power output (kW) and total static pressure, system-wide air volume and utilization, filter differential pressure, individual workstation activity as a percentage of shift time, controller health metrics (CPU, memory, disk), system logs, and calculated energy savings in both kWh and local currency. All data is available in metric or imperial units.
Which greenBOX models include DataMining?
DataMining is included as a standard feature on all greenBOX Nxt, Max, and Master controllers — no add-on purchase or subscription required. It is part of the Adelie family software platform.
How do I access greenBOX DataMining data?
The greenBOX includes a full-featured built-in web server. You access all dashboards and charts simply by typing the greenBOX URL into any browser on any device — phone, tablet, or computer. There is no limit on concurrent connections, so maintenance, operations, and management teams can all monitor the system simultaneously.
How long does the greenBOX store data?
The greenBOX retains a rolling 12 months of high-resolution data at 5-minute intervals. To maintain a permanent long-term record, Ecogate recommends downloading your CSV exports once per year before the oldest data rolls off.
Can I export greenBOX data to Excel or use it with AI tools?
Yes. The greenBOX provides three dedicated CSV export buttons: one for system-wide metrics (air volume, static pressure, filter pressure, utilization), one for VFD fan motor power, and one for granular workstation utilization. These files import directly into Microsoft Excel or Google Sheets, and can be analyzed with AI tools such as Microsoft Copilot, Claude, or Google Gemini for custom timeframe analysis, bottleneck identification, and month-over-month comparisons.
Can greenBOX DataMining help with utility incentive applications?
Yes. The VFD fan motor power CSV export is the specific data file that utility companies request when verifying electricity savings for incentive programs. Ecogate's engineering calculations and DataMining exports have supported incentive awards covering 50–70% of total project cost at facilities across North America.
How does greenBOX DataMining compare to Donaldson iCue, Nederman Insight, or Camfil GoldLink+?
Competing monitoring platforms focus primarily on the dust collector itself — cartridge life, filter condition, and maintenance alerts. Workstation-level activity, fan system performance, and factory-wide efficiency remain invisible to them. greenBOX DataMining monitors the entire system: every workstation gate, the full duct network, fan and VFD performance, filter condition, and energy savings — and unlike those platforms, it pairs monitoring with active control, adjusting fan speed and gate positions in real time based on what the data shows.
What can AI tools find in greenBOX workstation utilization data?
When exported CSV files are analyzed by an AI agent, common findings include identifying the highest-utilization workstations that represent production bottlenecks, flagging workstations with zero or near-zero utilization that may be redundant or schedulable for removal, and characterizing the overall utilization range across the facility. This continuous AI-driven evaluation supports data-backed decisions about production flow, staffing, equipment investment, and new facility design.


Comments