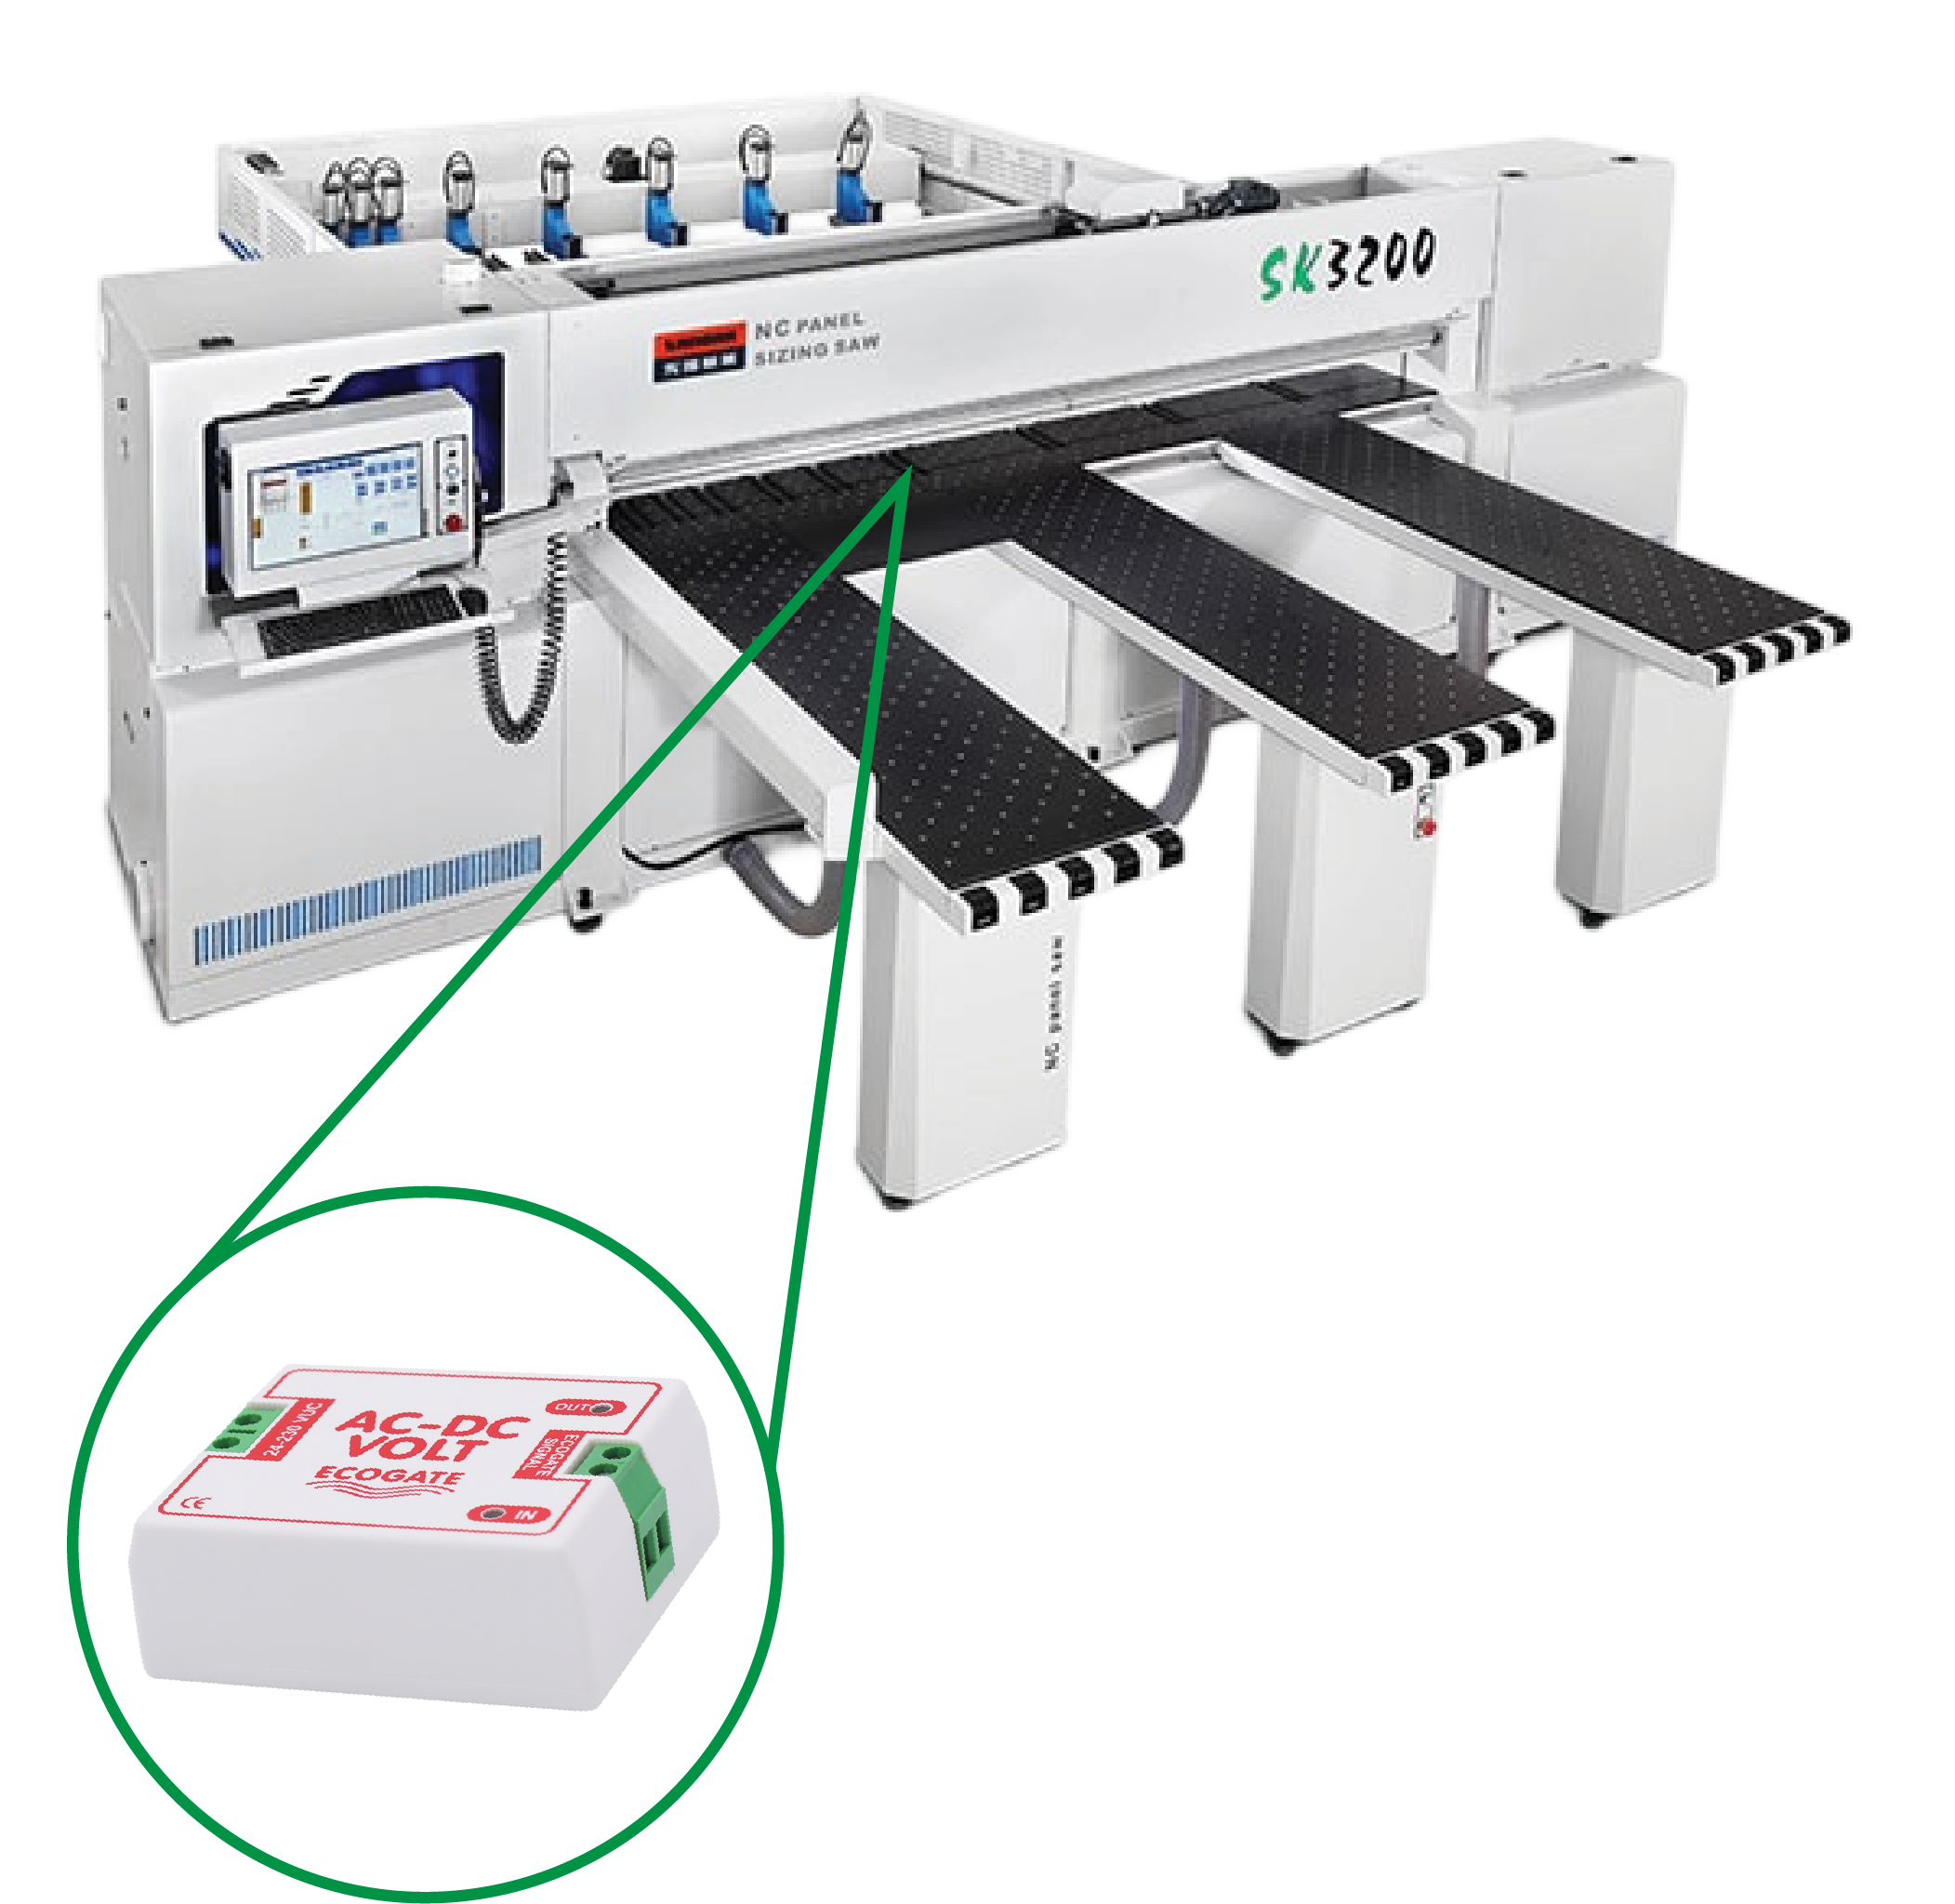
Sense production demand
Activity sensors detect when a machine or collection point requires ventilation, so the system responds to real production demand.
Explore Workstation Activity Sensors →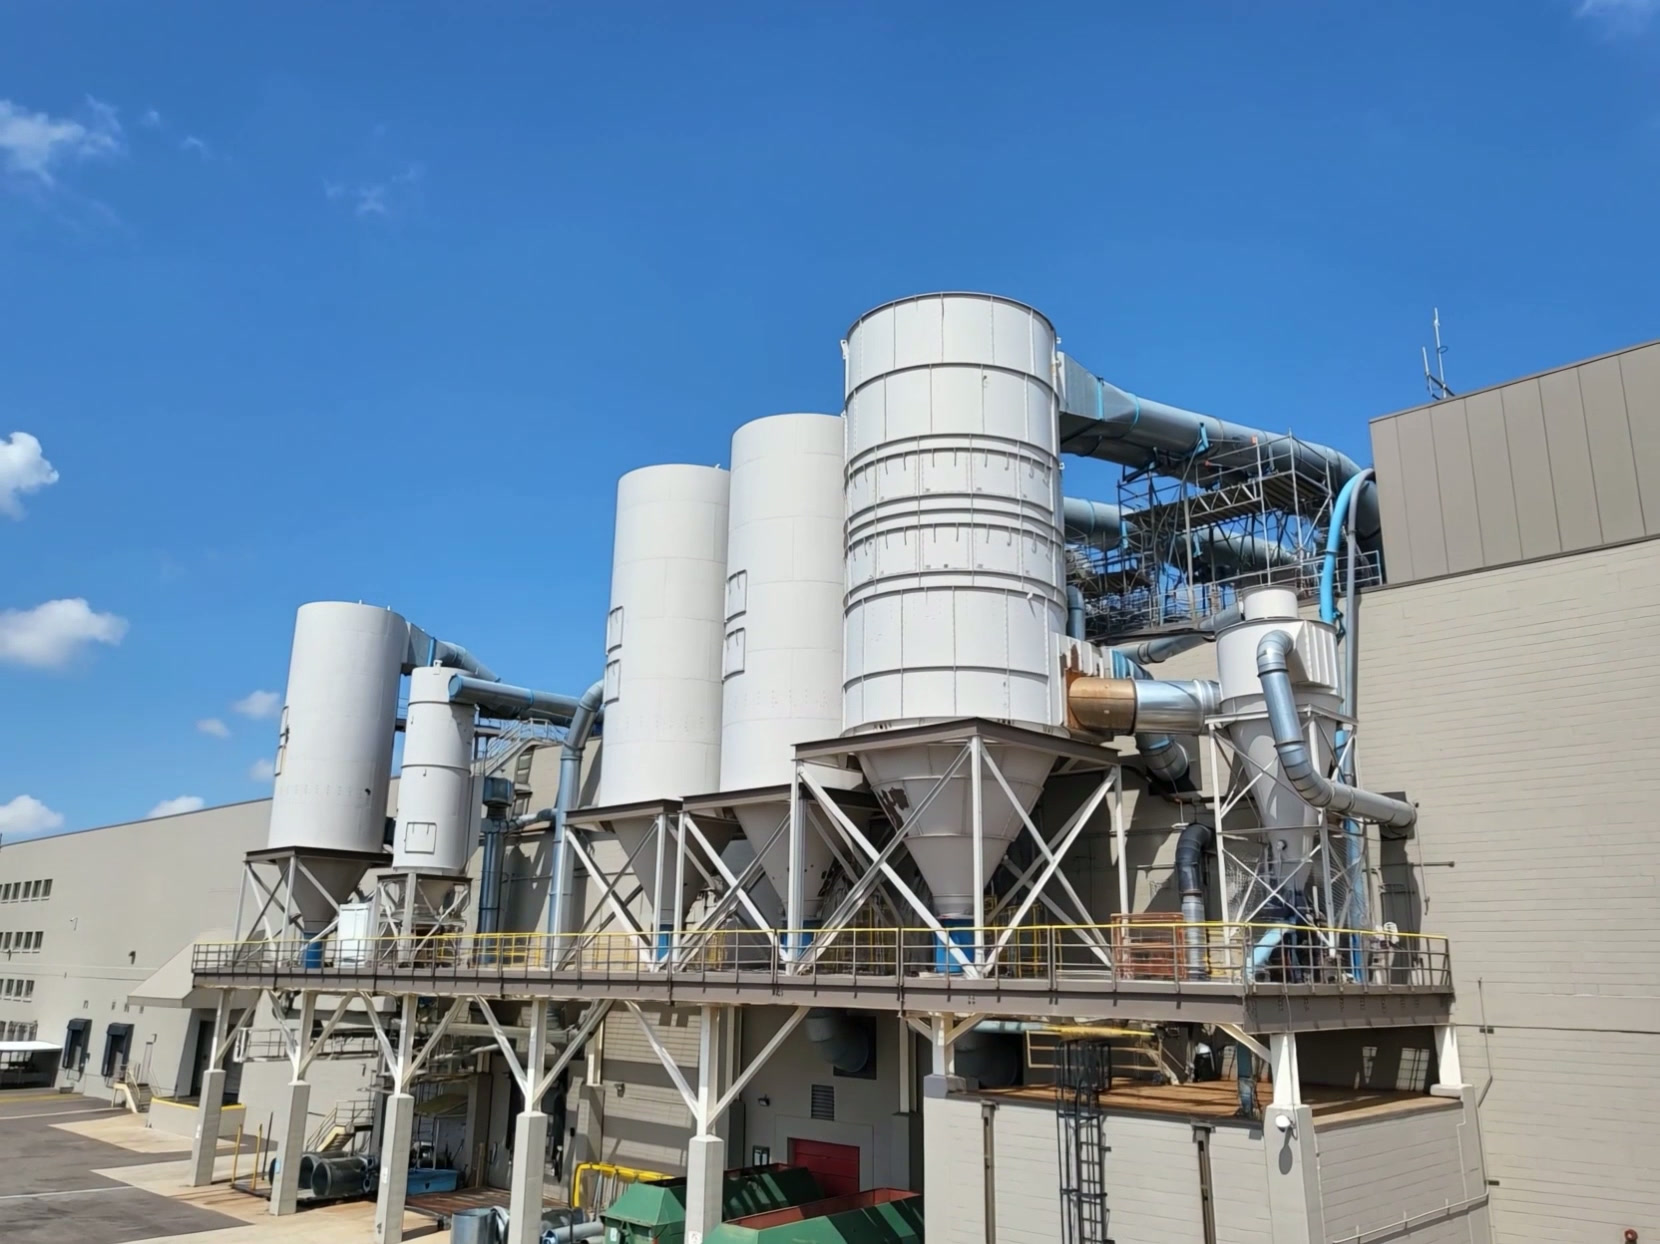
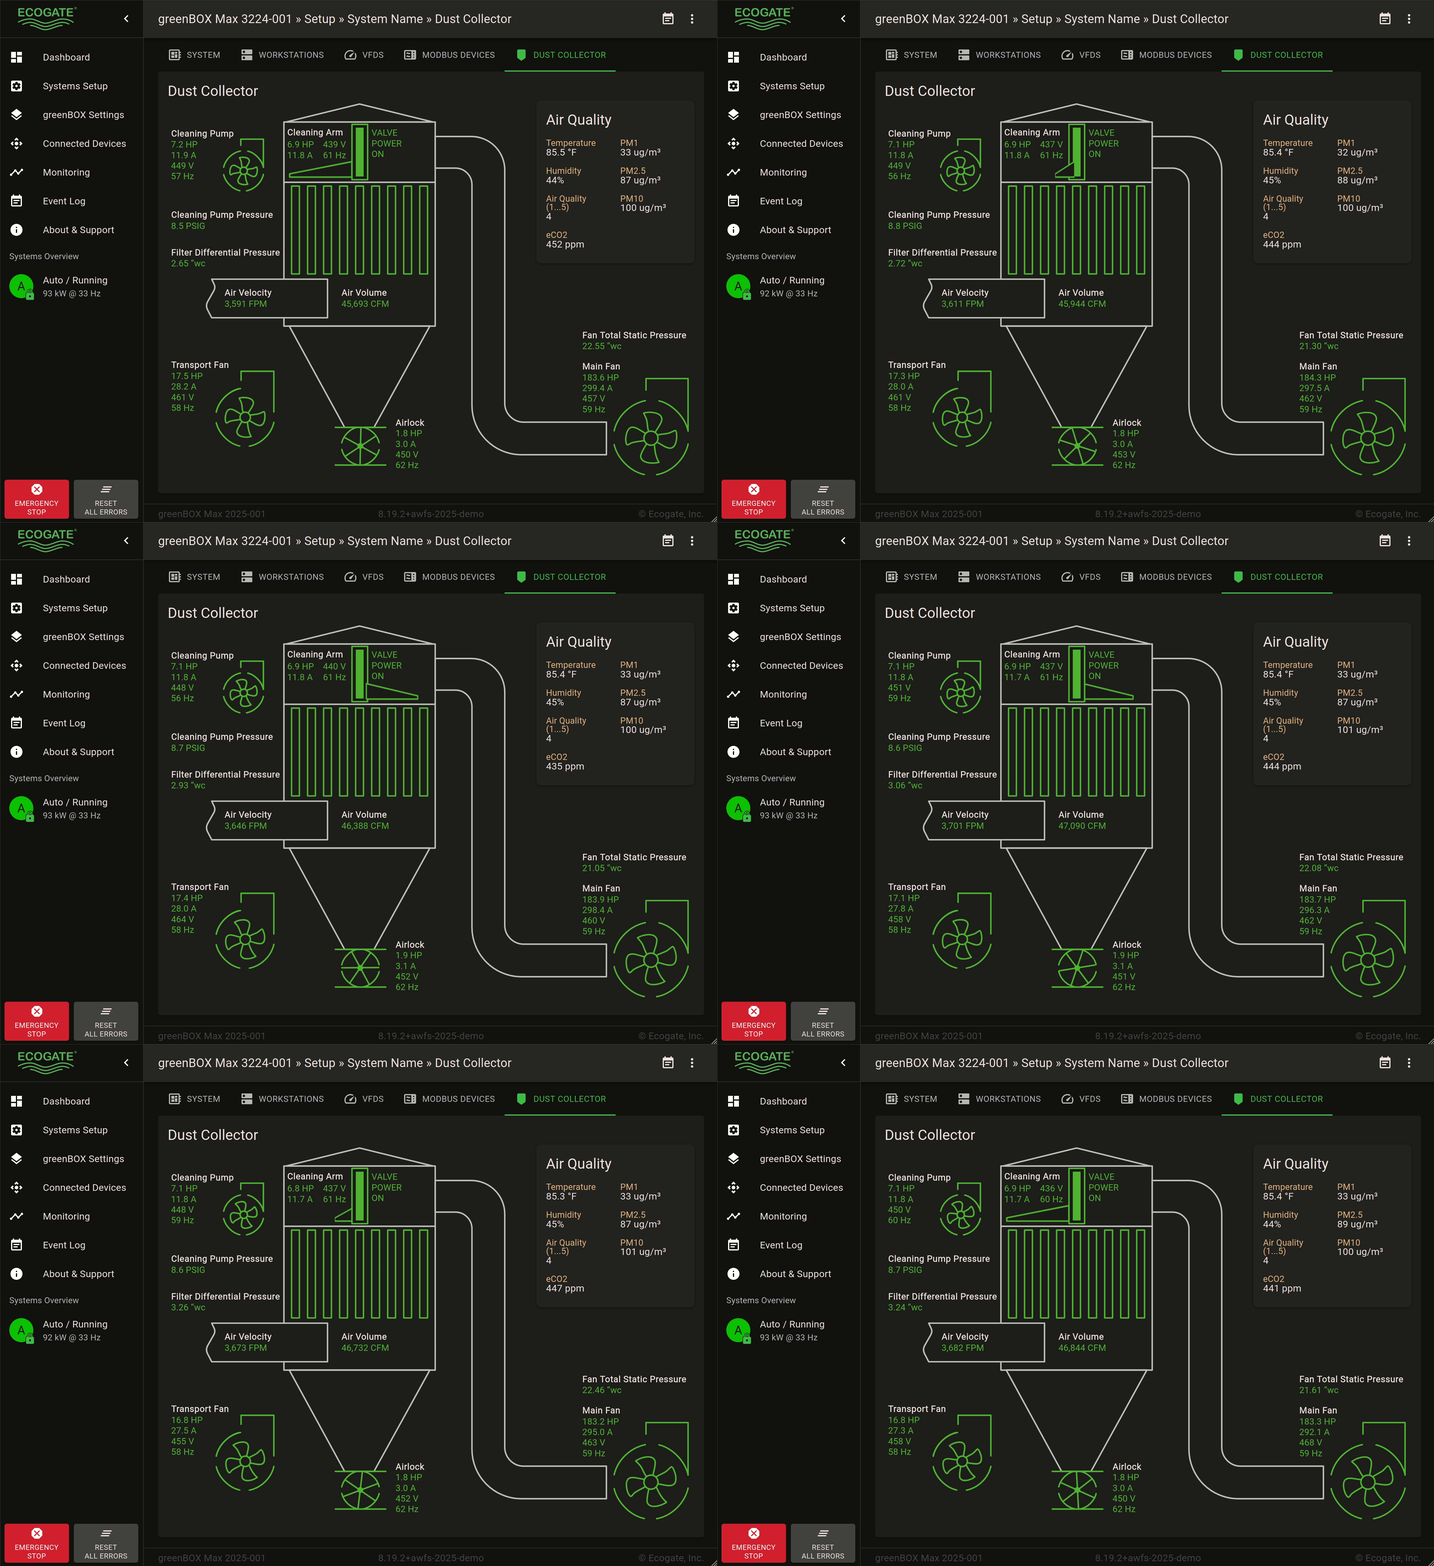
Ecogate makes industrial ventilation demand-based by directing airflow to active workstations and adjusting fan speed in real time. This cuts dust-collection fan electricity by about 66% on average while maintaining required minimum transport velocities.
Video: Ecogate demand-based industrial ventilation This video introduces how Ecogate demand-based industrial ventilation responds to production activity.
Sensors, gates, the greenBOX controller, fan-speed regulation, measurement, and reporting operate as one coordinated system. Each layer receives or confirms the same demand signal as production changes.
Activity sensors detect when a machine or collection point requires ventilation, so the system responds to real production demand.
Explore Workstation Activity Sensors →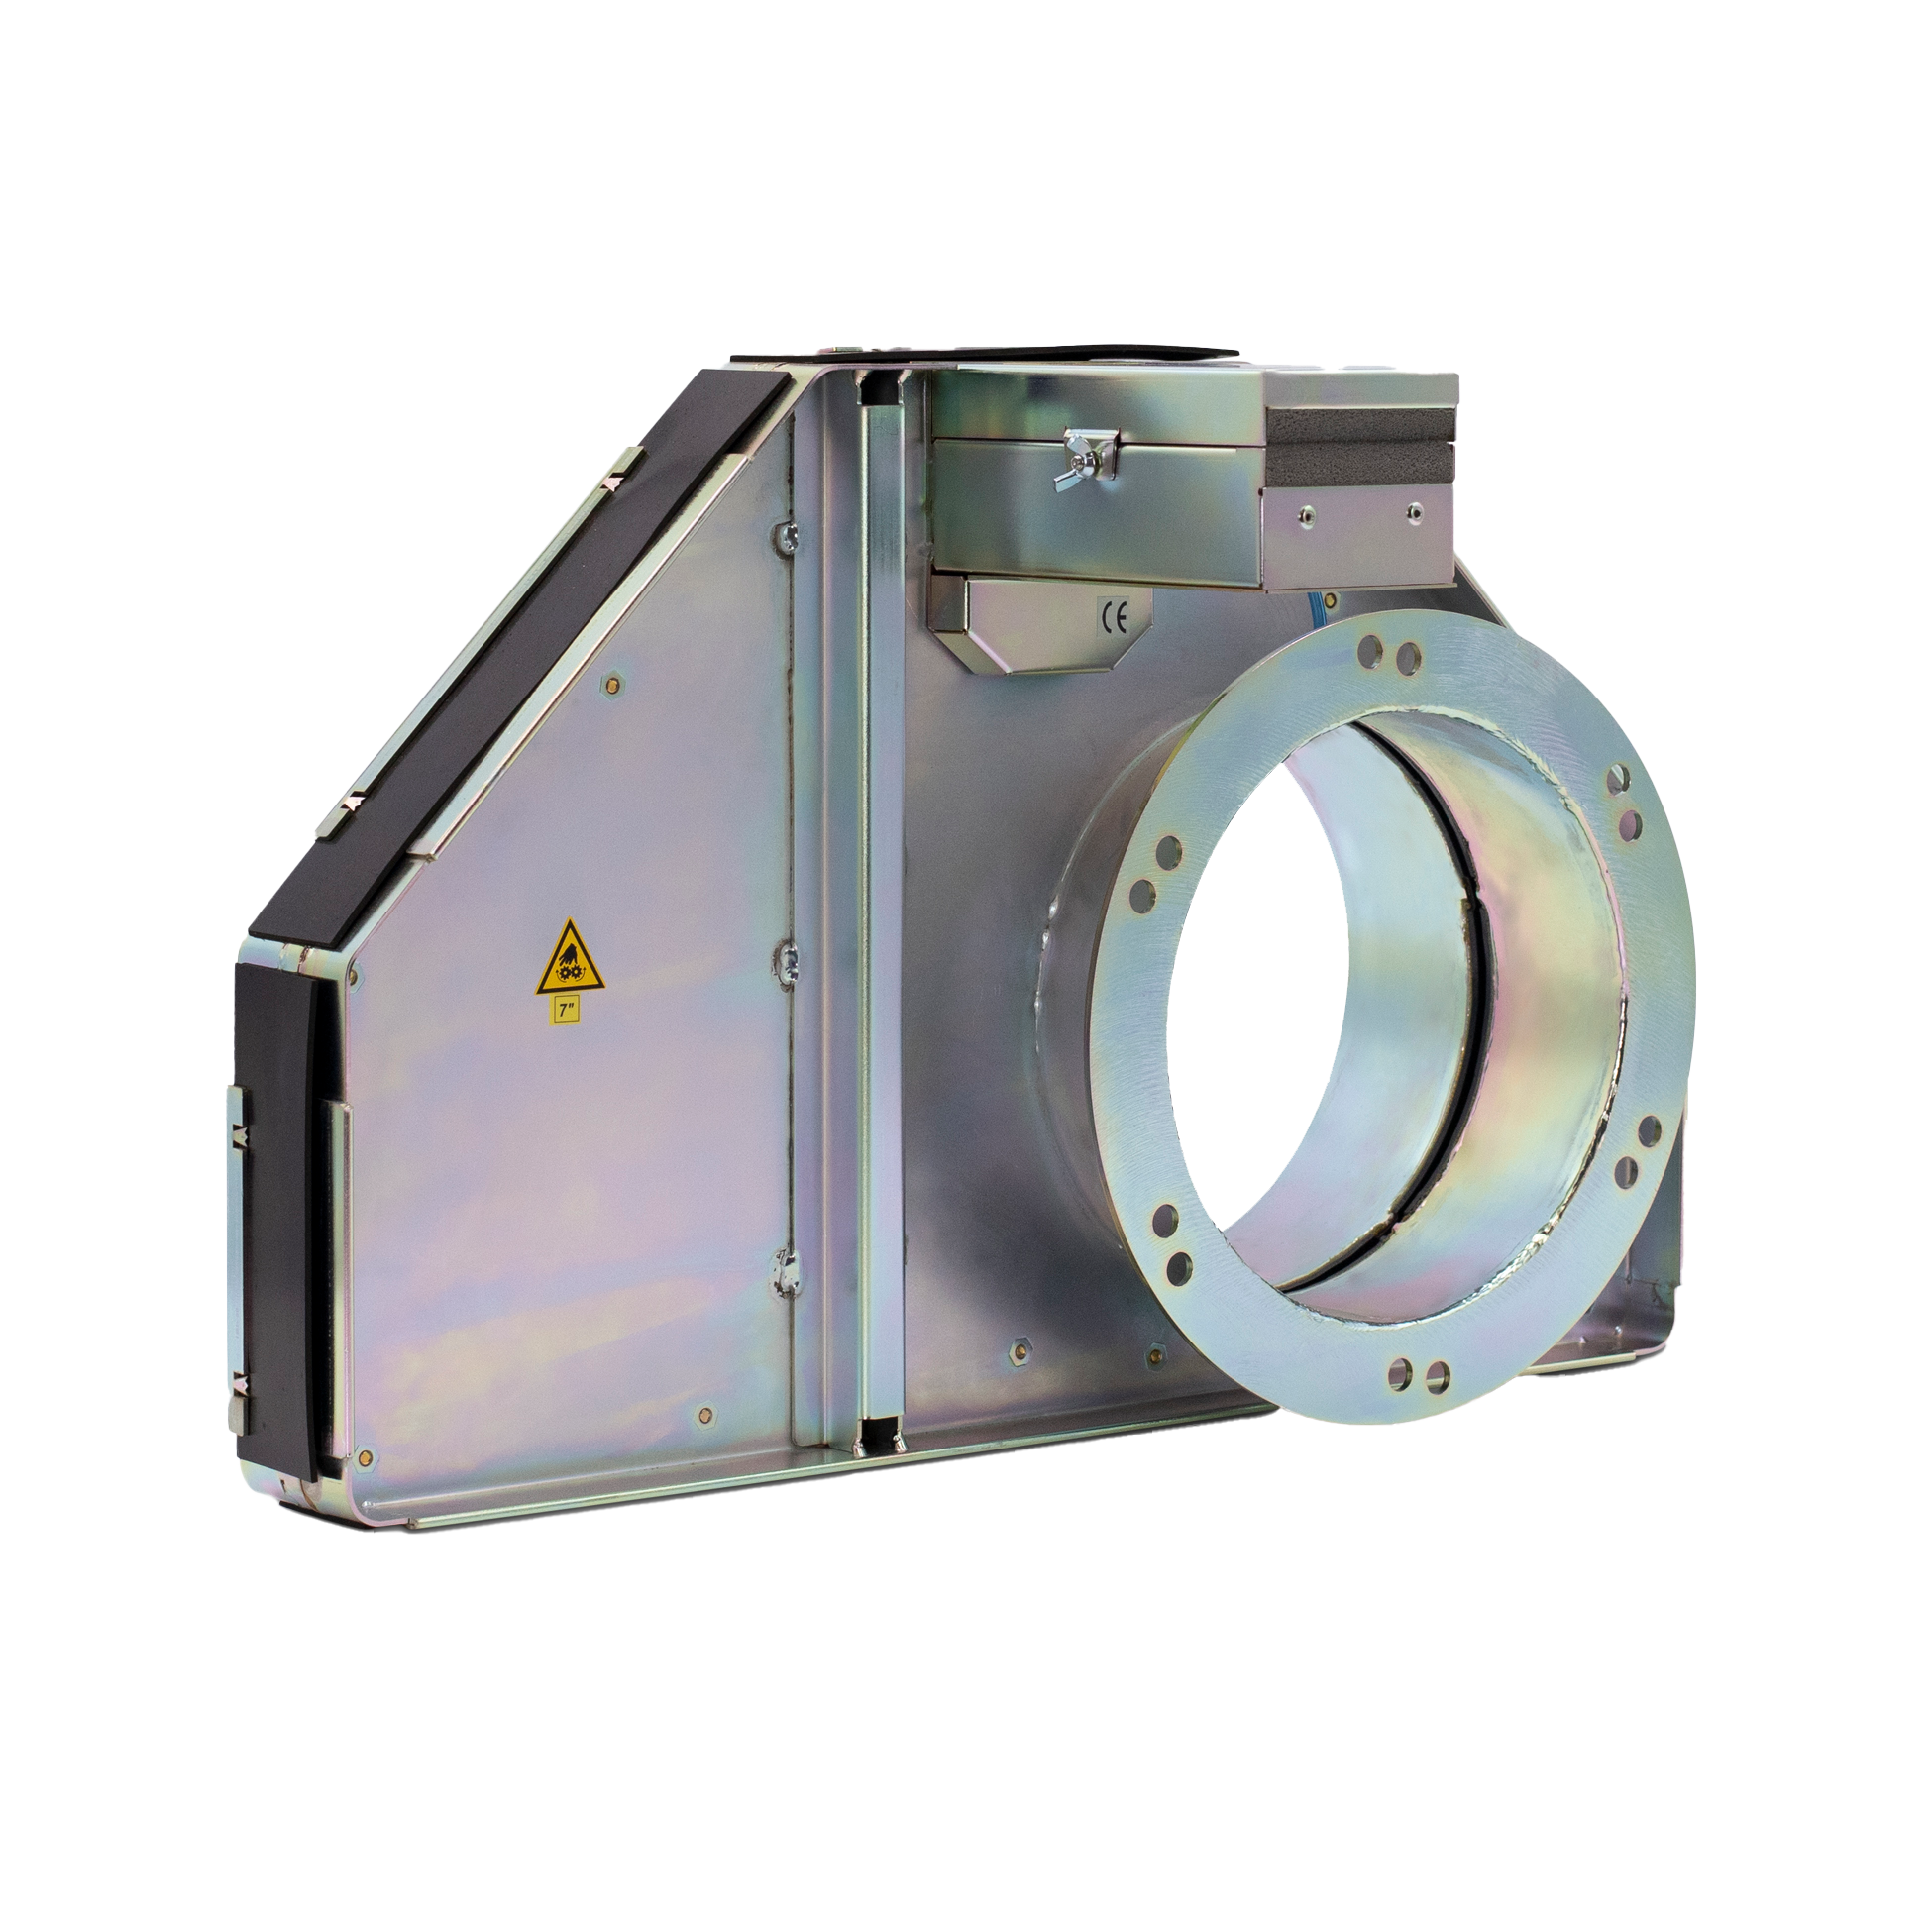
The corresponding automatic gate opens to direct airflow to the active workstation. Smart and Precision Airflow Gates can also report pressure, velocity, and volume.
Explore Ecogate Smart Gates →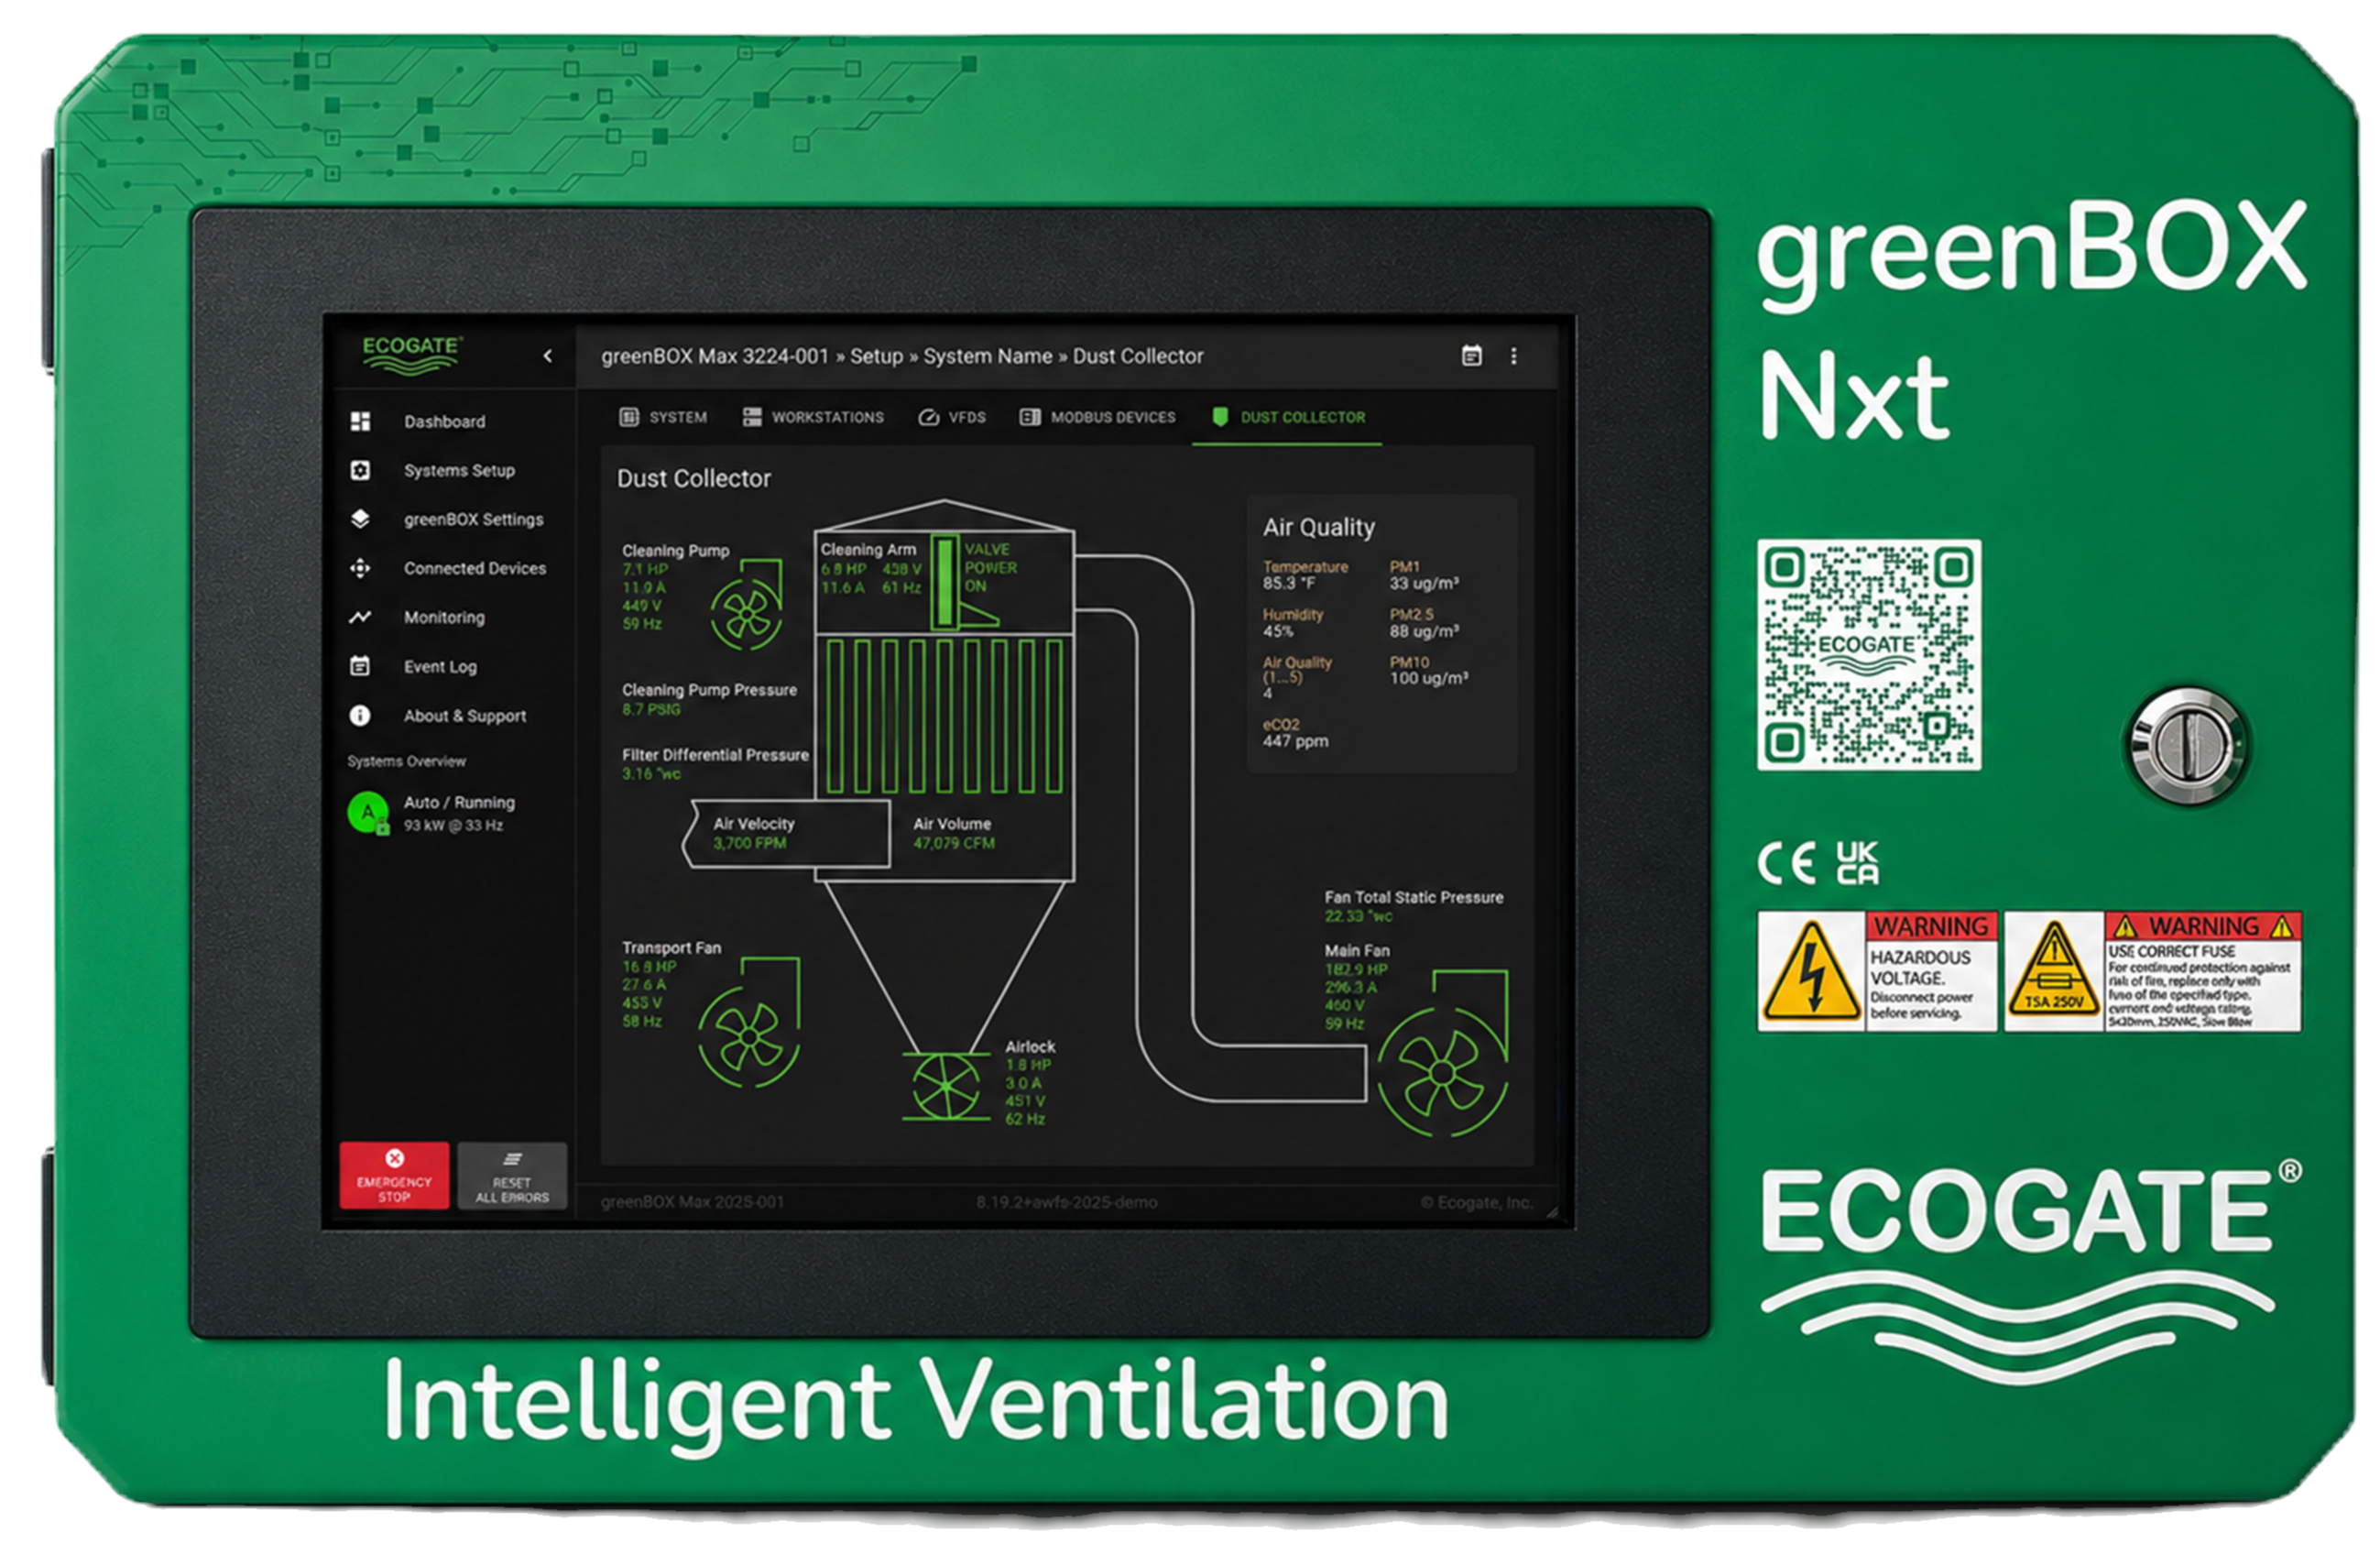
The greenBOX combines demand across the duct system, calculates the required fan airflow, and protects the configured minimum transport velocity.
Explore the greenBOX →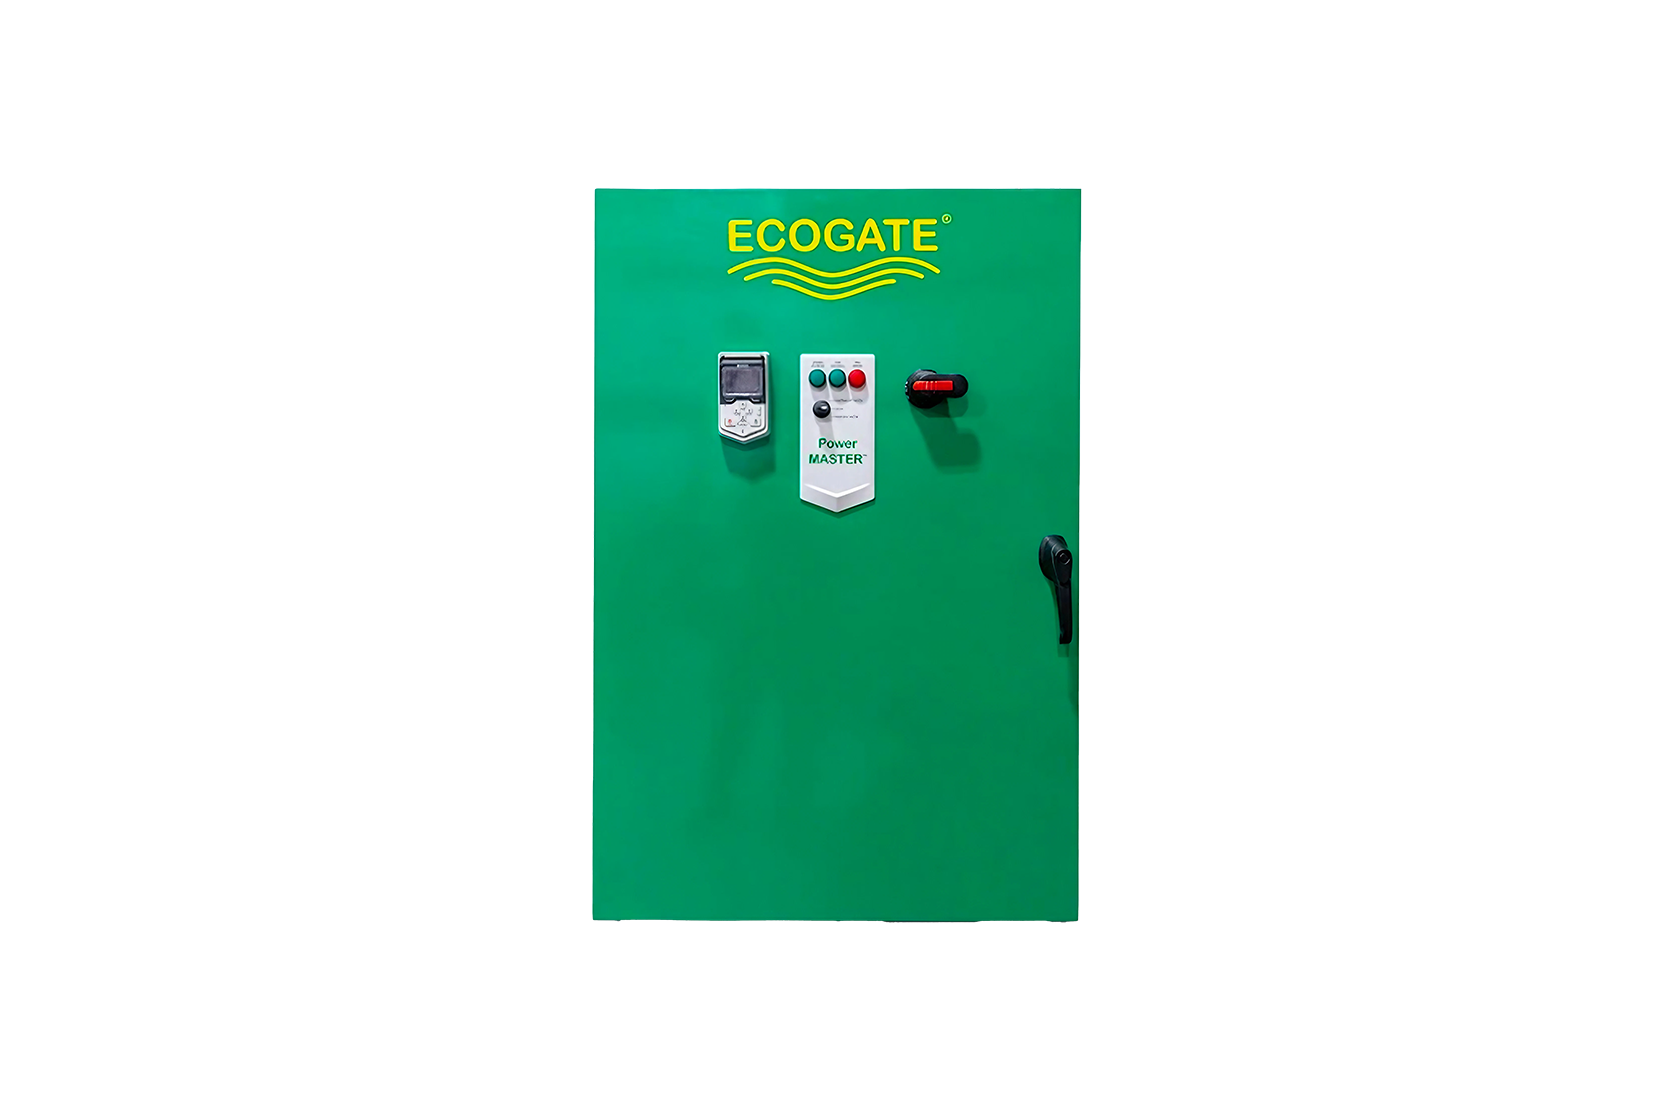
Power Master follows the airflow command from the greenBOX and regulates fan speed as the combination of active workstations changes.
Explore Power Master VFD →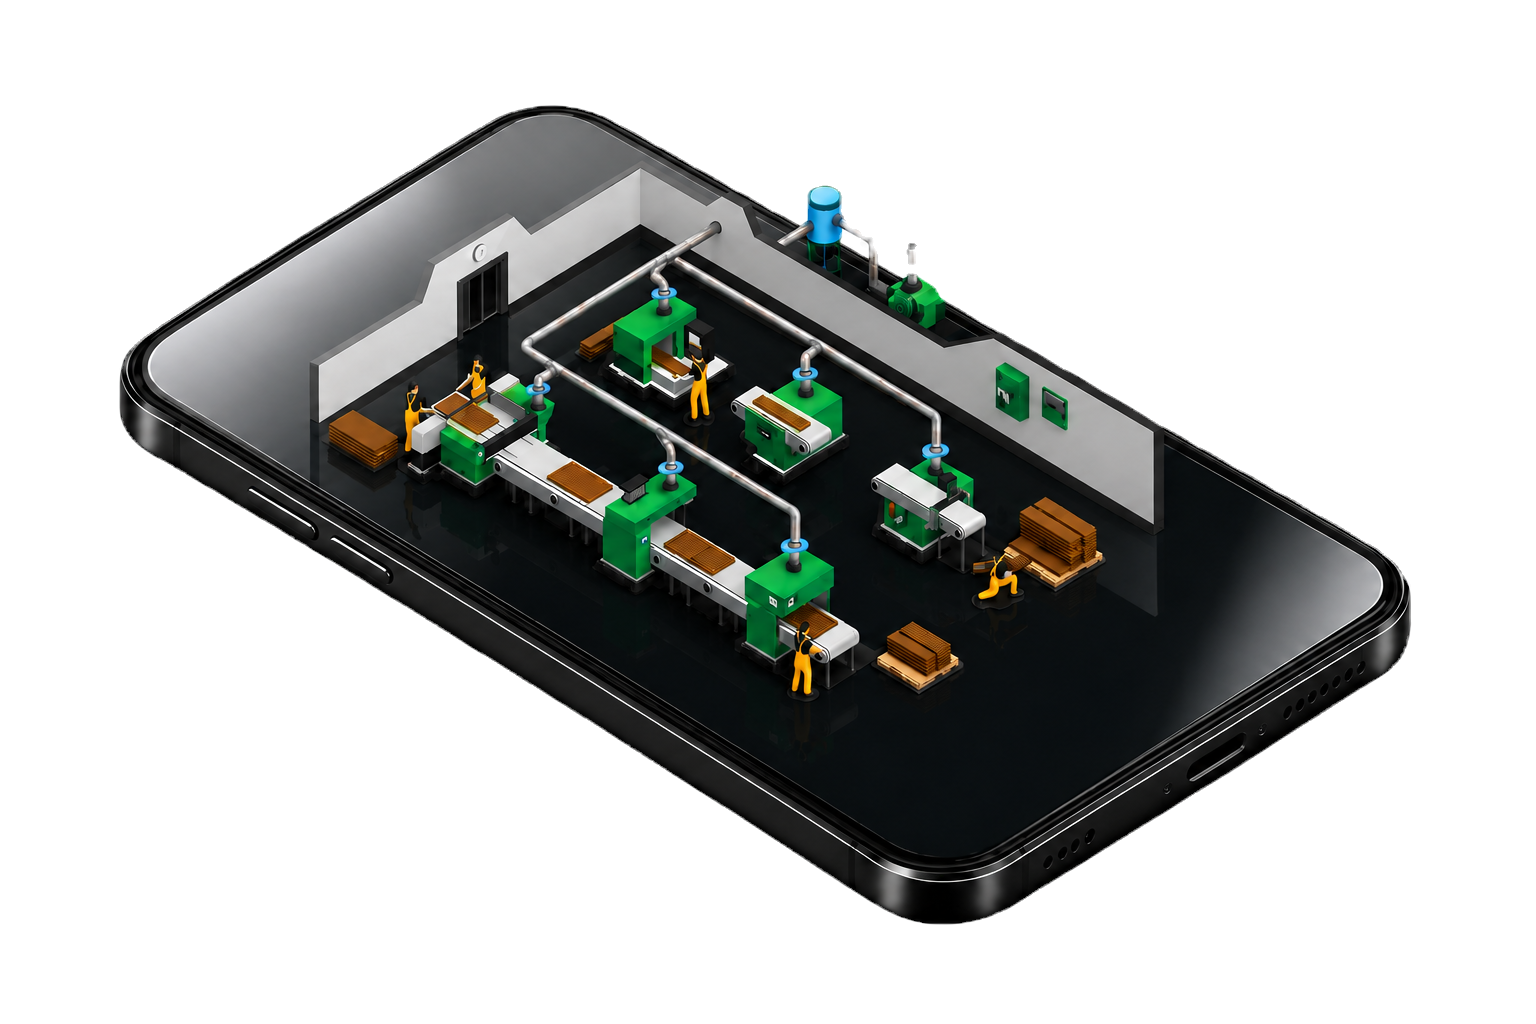
System measurements and Ecogate Analytics make airflow, pressure, fan power, savings, utilization, and performance visible.
Explore Ecogate Analytics →The utilization data shows why total airflow demand changes throughout production. The fan curve shows why even modest airflow reductions can produce disproportionately large theoretical energy savings.
Actual workstation-utilization data from a U.S. woodworking facility.
The curve illustrates Fan Affinity Law physics. Actual savings depend on fan efficiency, pressure losses, production demand, system condition, and the final engineered configuration.
Select a production scenario or individual workstations. Watch the greenBOX continuously recalculate demand, direct airflow through Smart Gates, open additional gates when needed to protect minimum transport velocity, and command the Power Master VFD as production changes.
Visitors can select production scenarios or individual workstations and observe how the greenBOX recalculates airflow demand, directs airflow through Smart Gates, protects configured minimum transport velocity, and commands the Power Master VFD.
This simulator is an educational representation. Displayed airflow, fan power, and velocity thresholds are illustrative. Actual requirements and performance depend on the collected material, connected equipment, configured air volumes, duct conditions, commissioning, and calibration.
What began at this trade show became a three-system dust collection upgrade at Metrie's Ferndale, Washington facility.
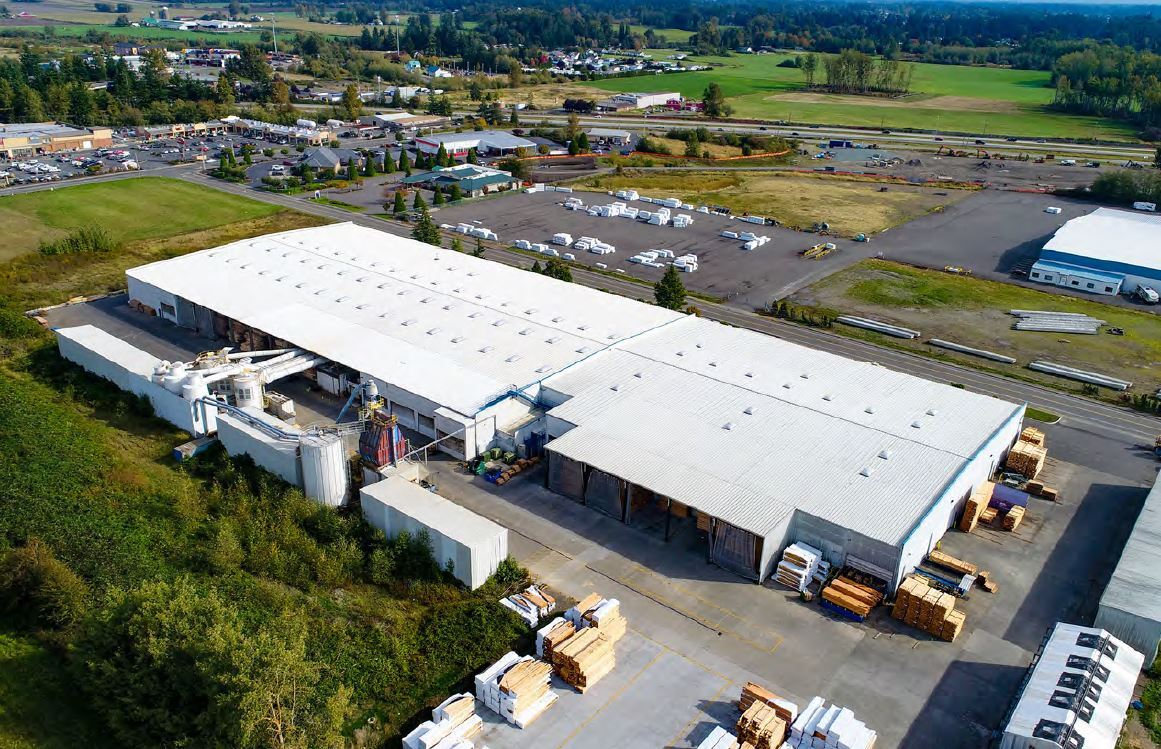
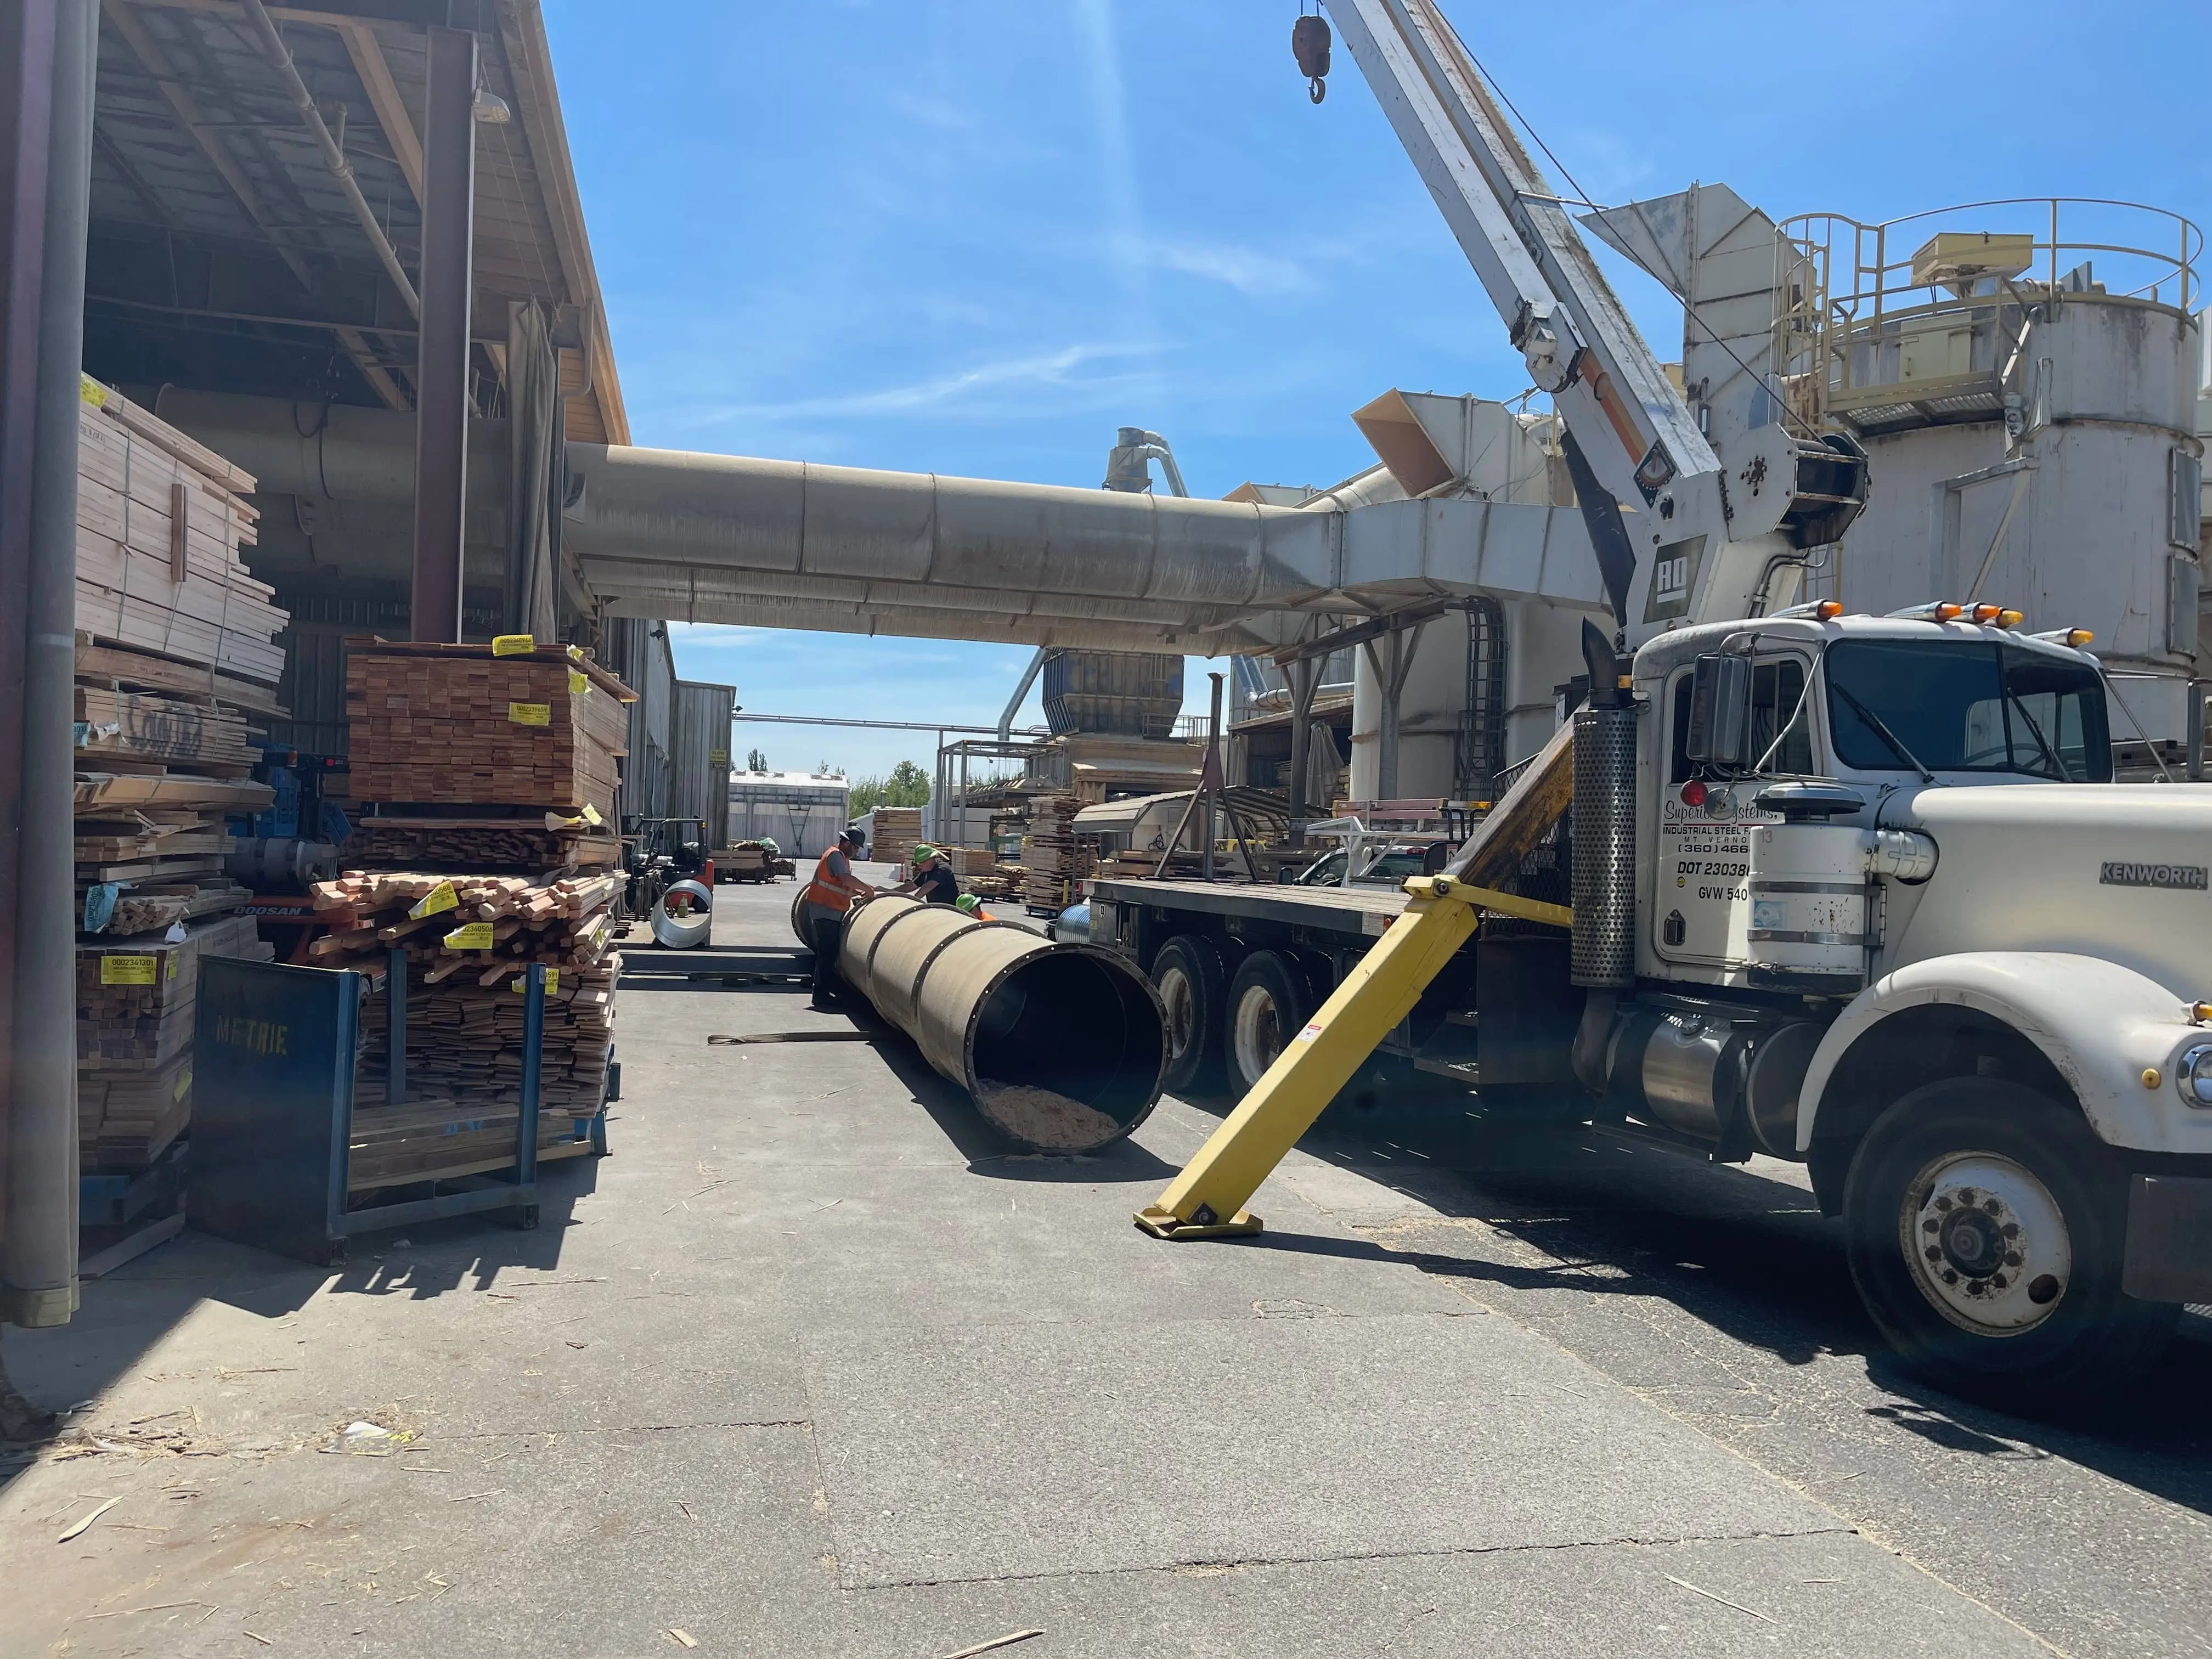
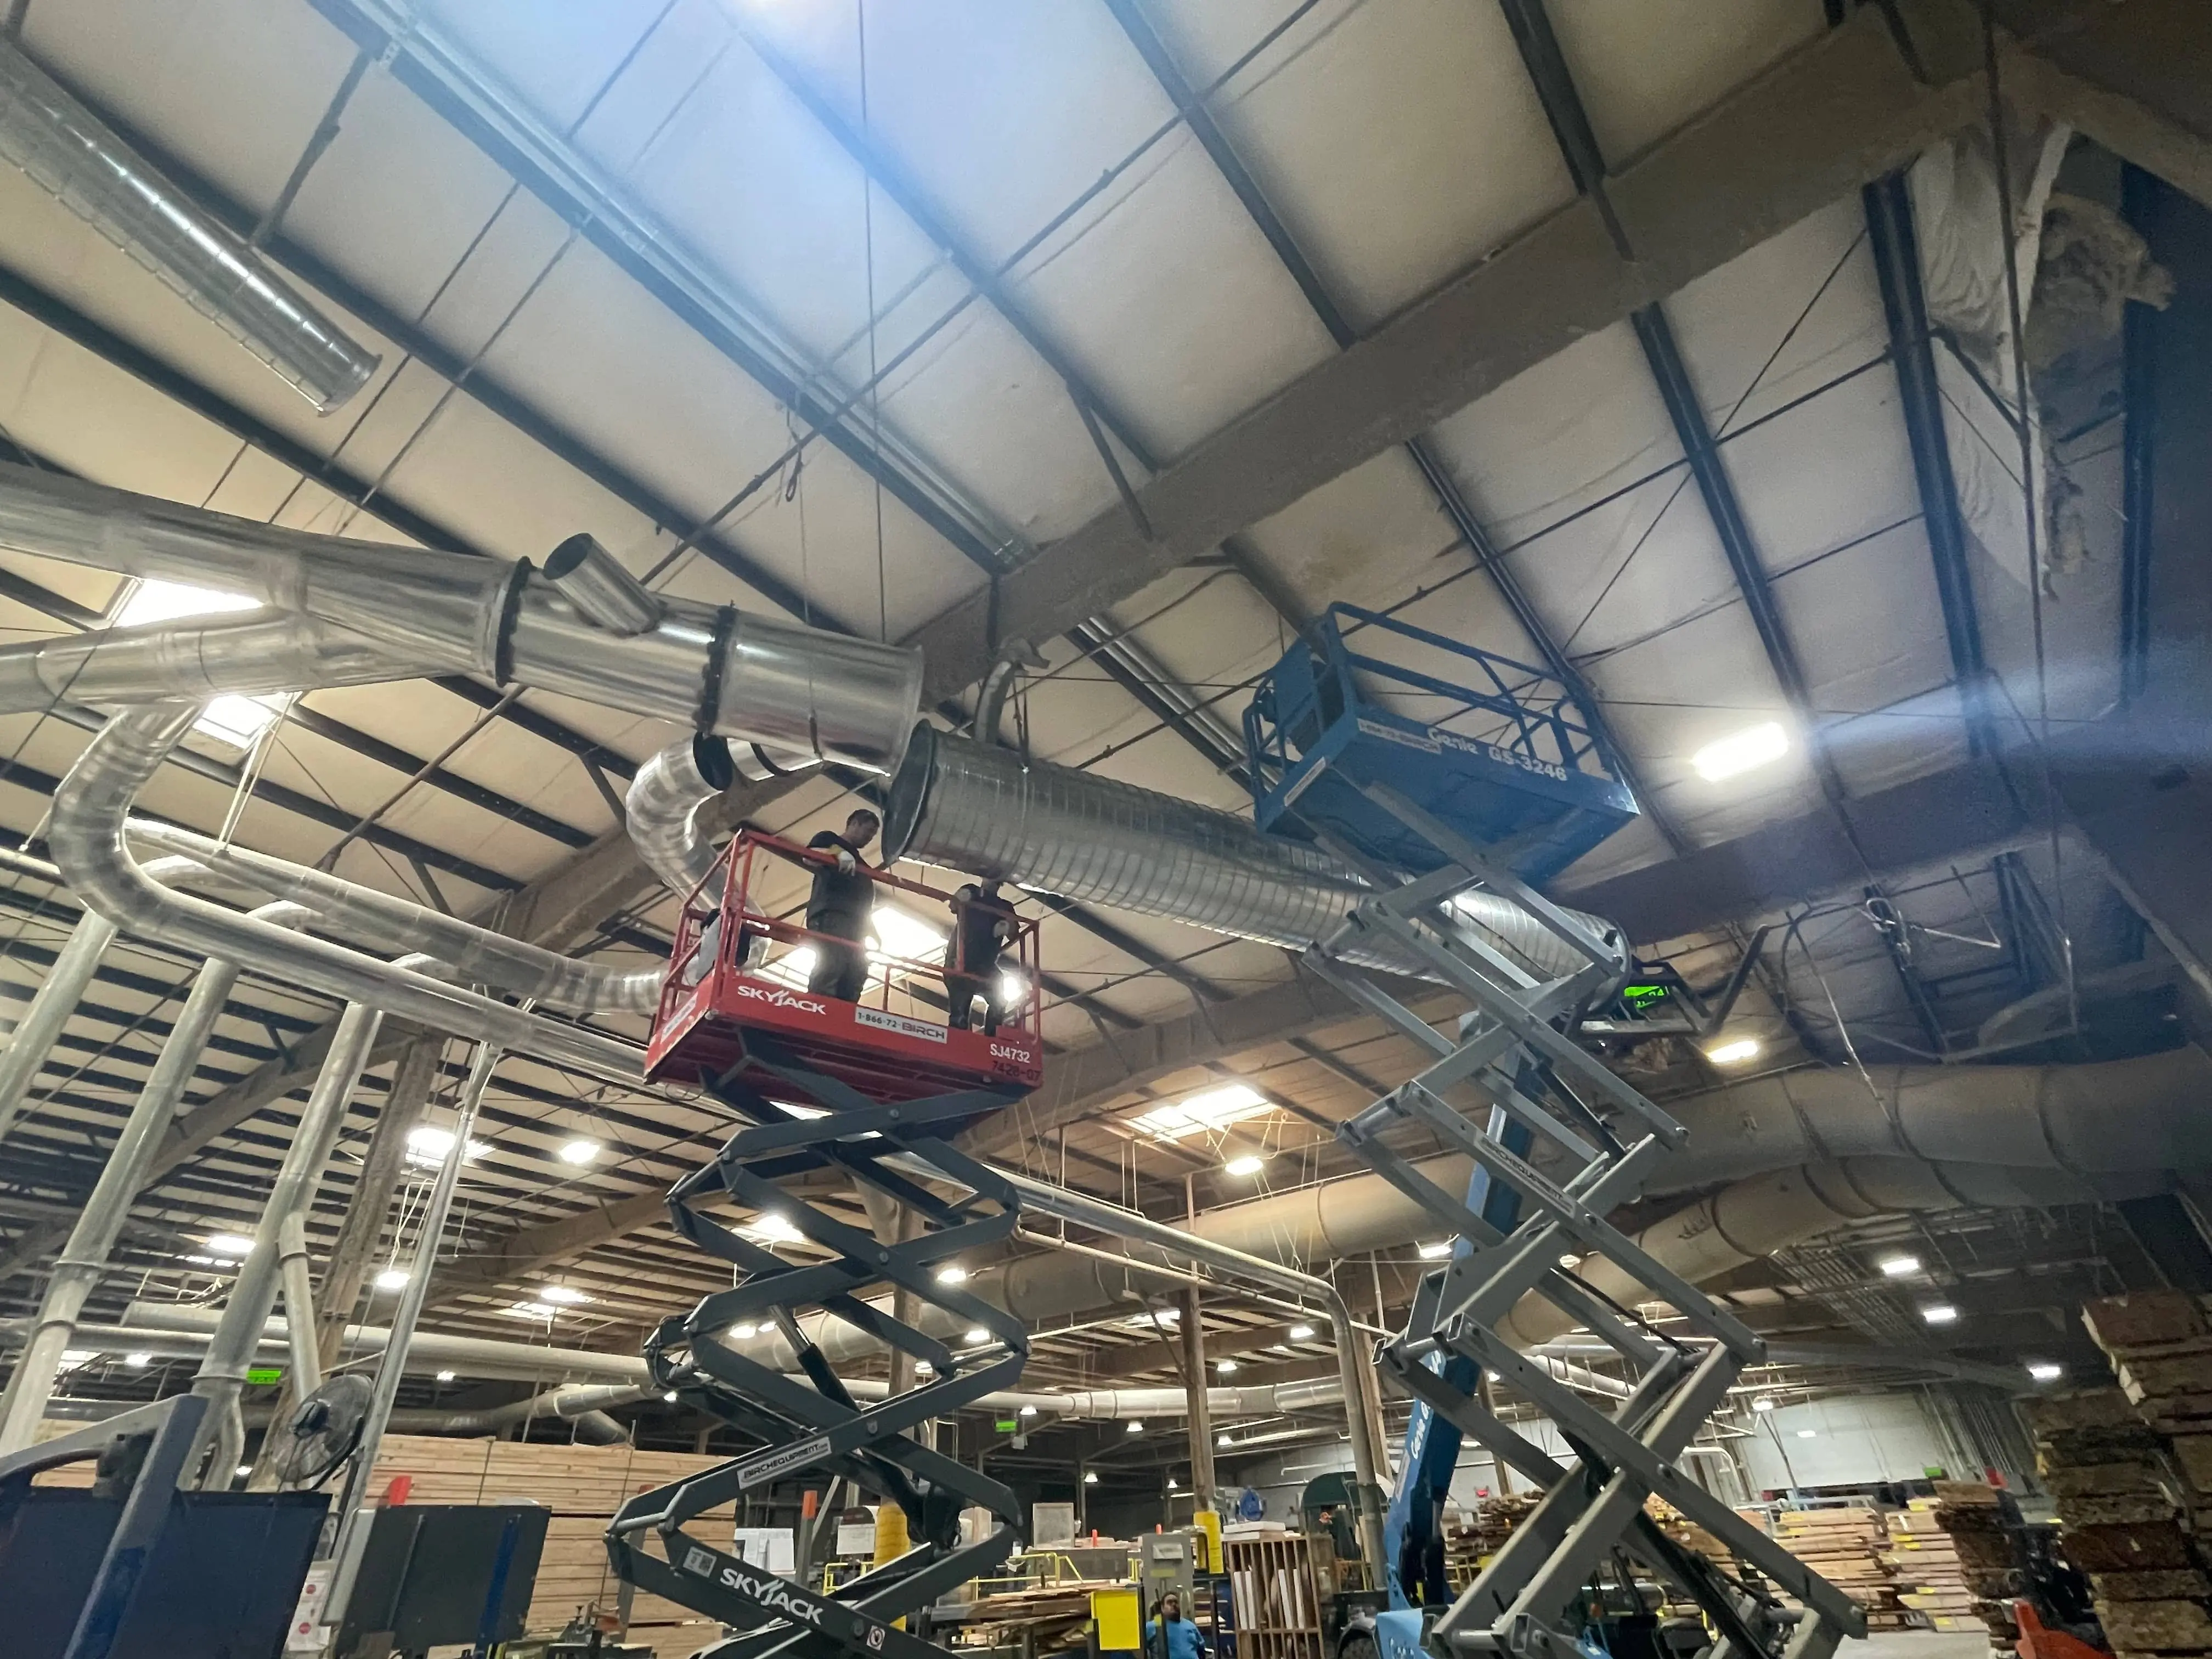
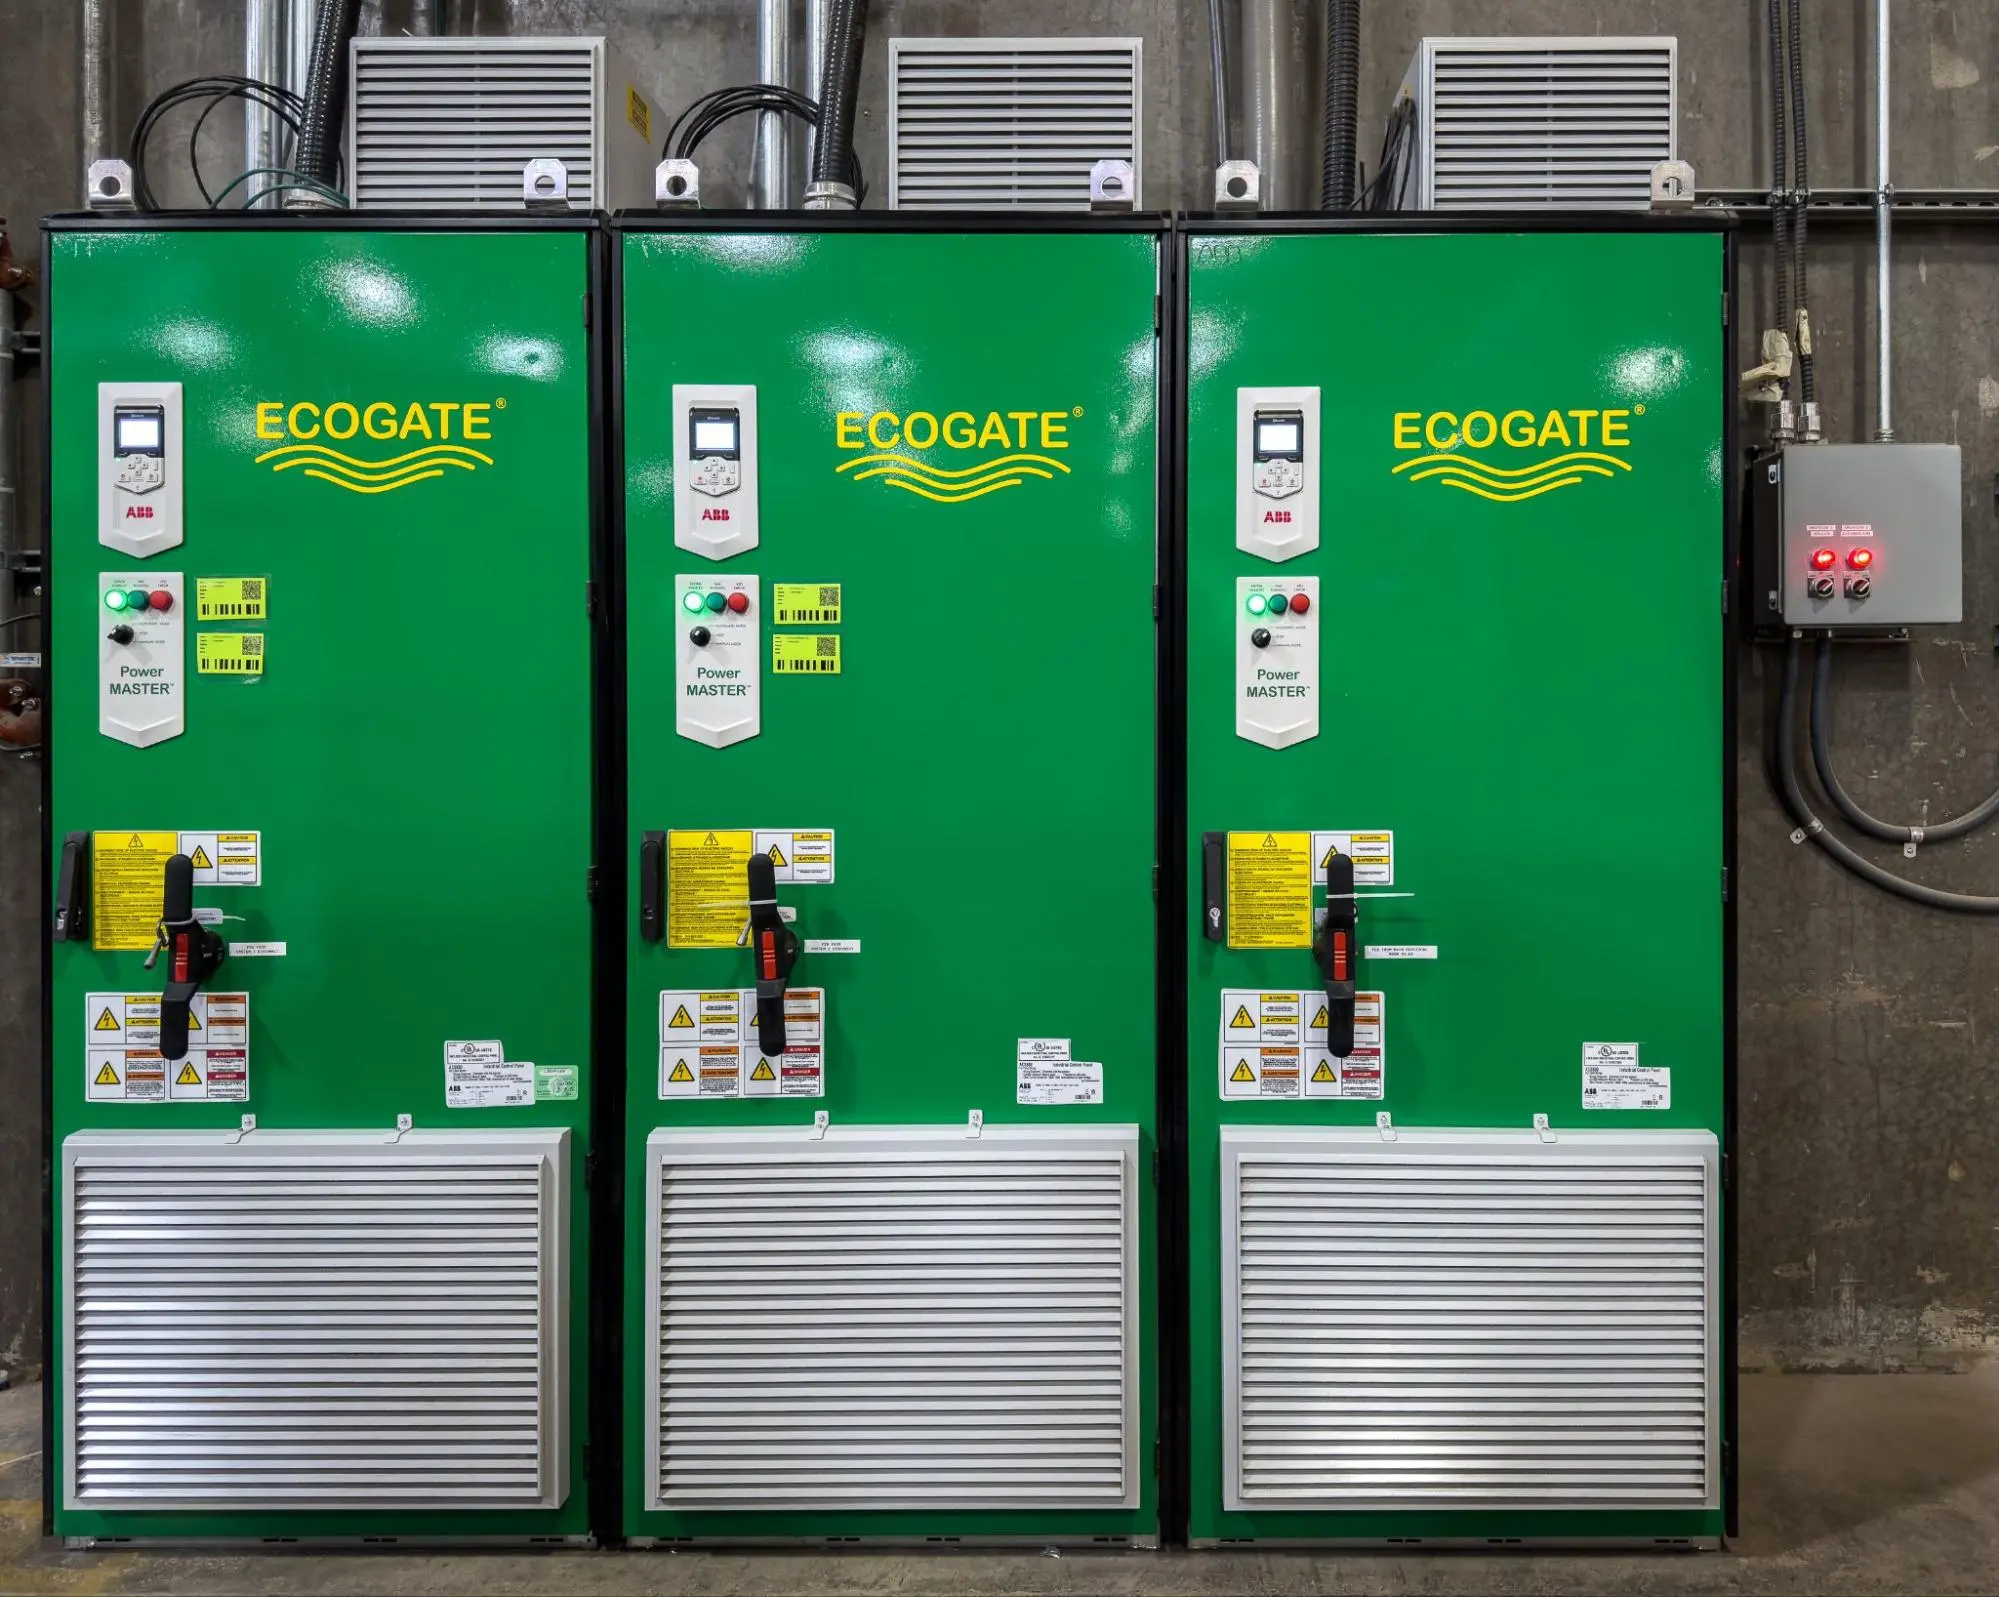
Projected savings, incentive coverage, and early operating results are specific to the Metrie Ferndale project.
Read the Metrie Case Study →Choose full motor control with the Dust Collector Controller, or add collector-side monitoring with the Dust Collector Interface. Both bring operating data into the Ecogate system.

Adds coordinated VFD control for collector motors, automatic operating sequences, fault protection, and real-time monitoring.
Video: Dust Collector Interface wired as a Dust Collector Controller See how the DCI sensor platform is paired with VFDs and wired to provide full Dust Collector Controller functionality.
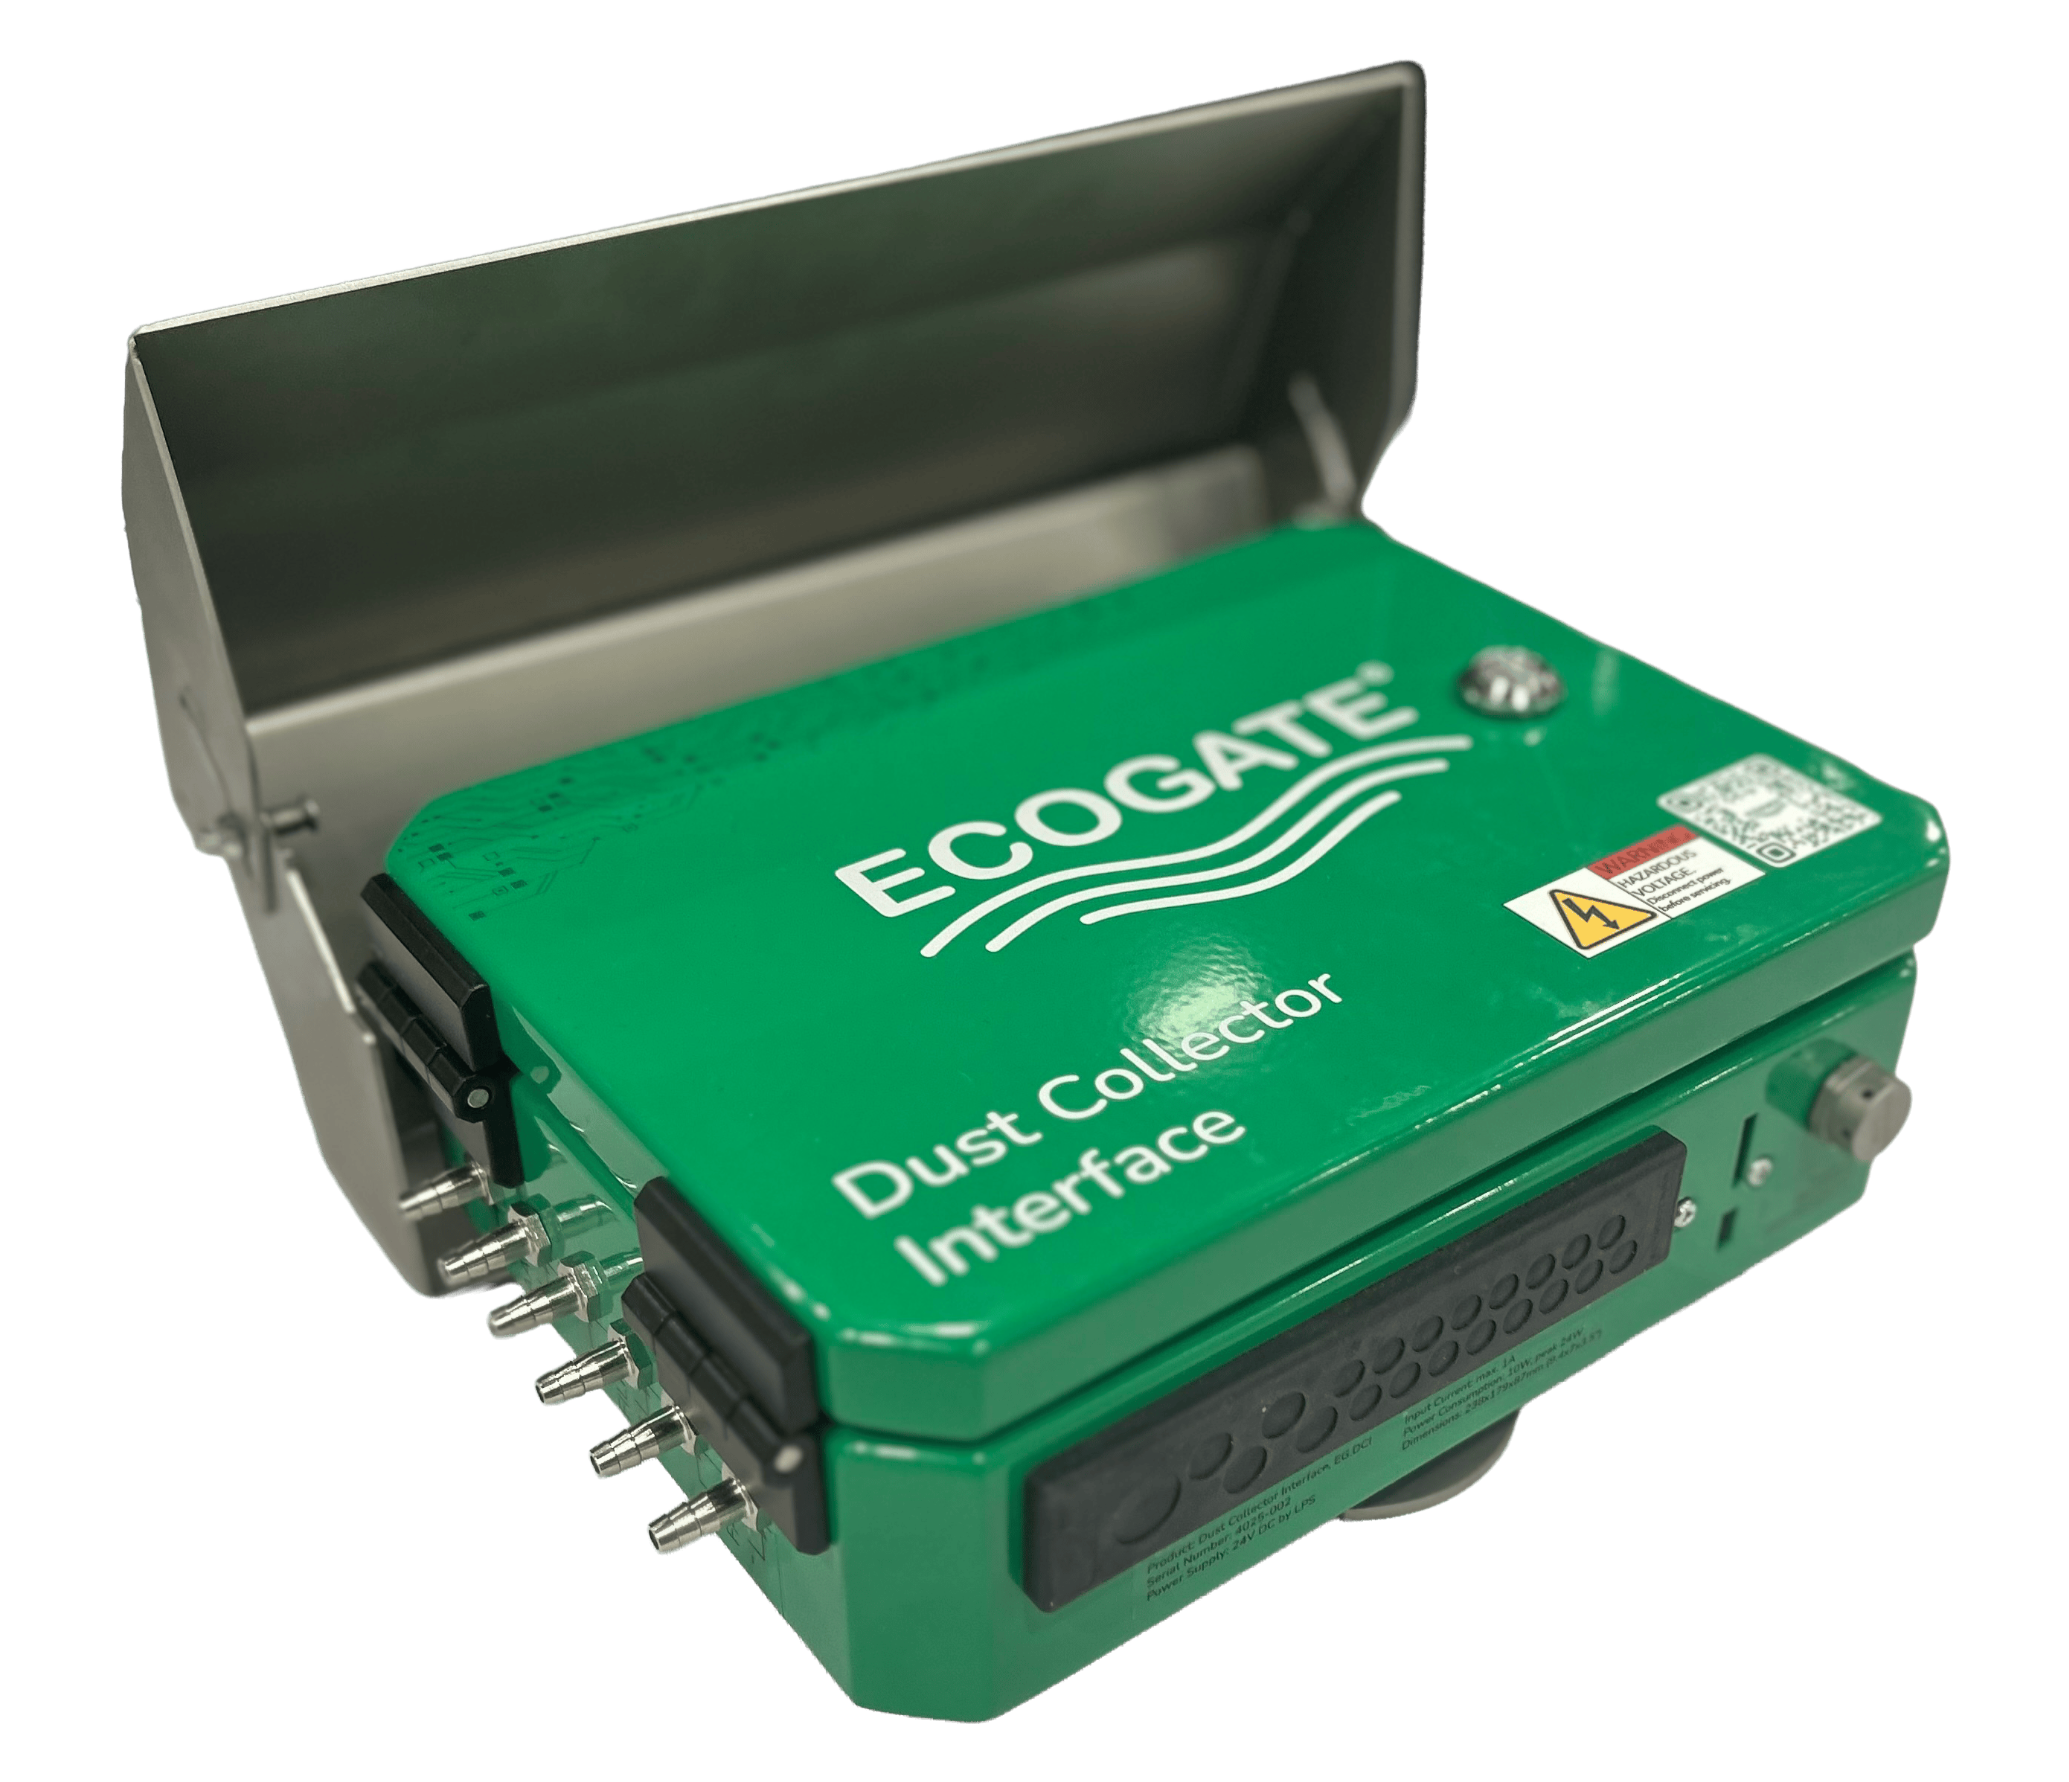
Adds collector-side airflow, pressure, environmental, alarm, and operating-status data without controlling the collector motors.
Video: Overview of Ecogate's Dust Collector Interface See the DCI sensor suite, its connection to the greenBOX, and the collector information it makes available in real time.